Office Space
1288 West Grand River Road Howell, MI 48843
1288 West Grand River Road Howell, MI 48843

Details & Description
Property Highlights
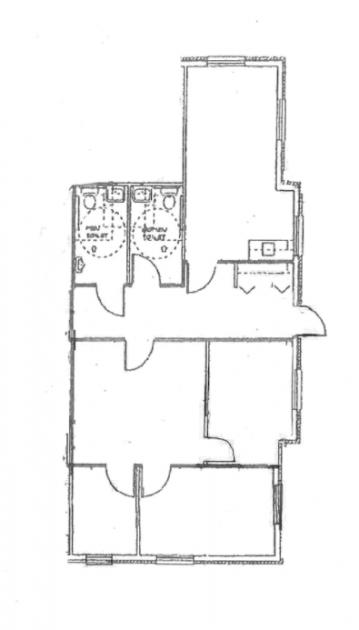
- • Existing medical suite
- • X-ray room
- • Plenty of parking
- • Can be split
- • Professional office environment
- • Great visibility on Grand River
Listing Agents

Steve Slater
O: 517-487-9222
M: 517-749-7914
steveslater@naimidmichigan.com
O: 517-487-9222
M: 517-749-7914
steveslater@naimidmichigan.com
While we strive to provide the most accurate information, all listing information, and demographic data, is provided by third-parties. As such, MyEListing will not be responsible for the accuracy of the information. It is strongly recommended that you verify all information with the listing agent, and any relevant agencies, prior to making any decisions.