Office Space
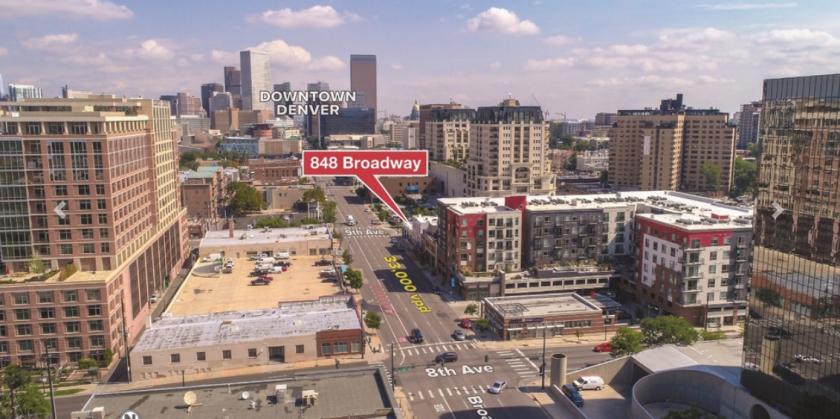
848 Broadway Denver, CO 80203
848 Broadway Denver, CO 80203
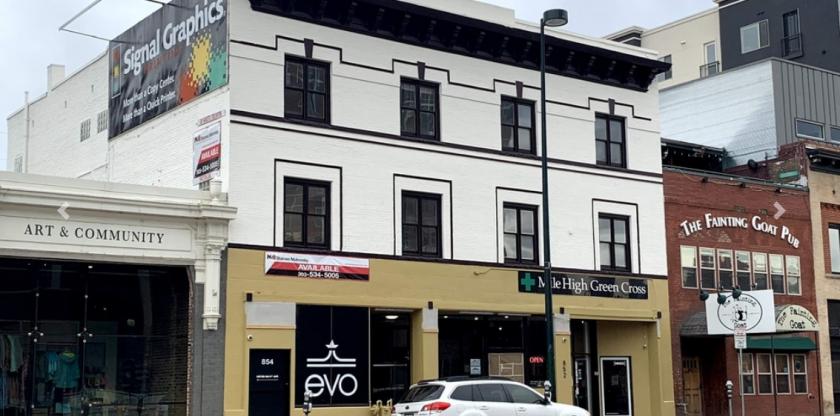
Details & Description
Property Highlights
• 11 offices built around a common corridor - ideally suited for social distanced offices and can be demised to 1,450 SF
• Short walking distance to vibrant local retail, restaurants, cafes, museums, parks, and other cultural venues
Listing Agents

Todd Snyder
O: 720-881-7533
M: 303-704-6322
tsnyder@shamesmakovsky.com
O: 720-881-7533
M: 303-704-6322
tsnyder@shamesmakovsky.com
While we strive to provide the most accurate information, all listing information, and demographic data, is provided by third-parties. As such, MyEListing will not be responsible for the accuracy of the information. It is strongly recommended that you verify all information with the listing agent, and any relevant agencies, prior to making any decisions.