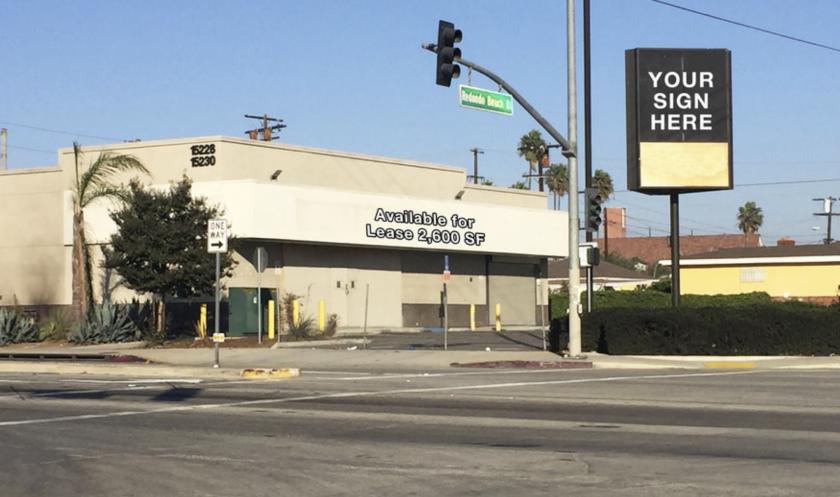
Retail Space
15228 South Avalon Boulevard Compton, CA 90220
15228 South Avalon Boulevard Compton, CA 90220

Details & Description
Property Highlights
- • New Construction with Excellent Curb Appeal
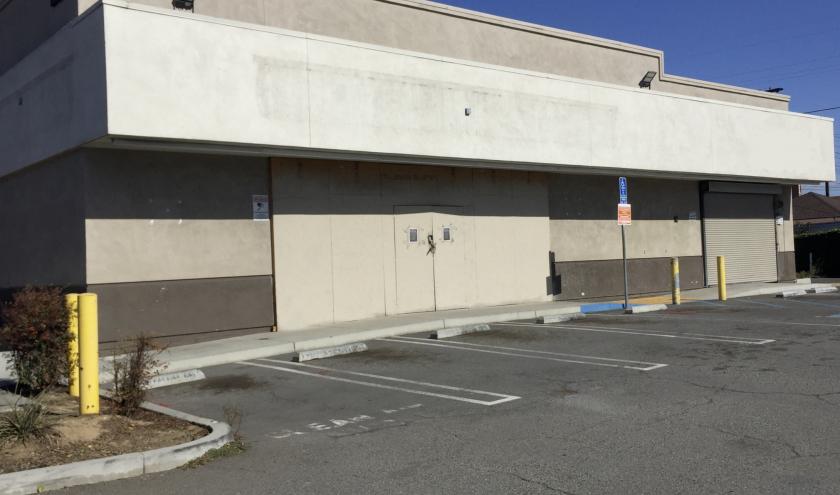
- • Excellent Visibility with Easy Access Parking
- • Highly Visible Pylon Signage Available
- • Extended Term Available
- • Average Daily Traffic Counts of Over 19,000
Additional Photos

Listing Agents

Tony Michelman
O: 818-742-1621
tmichelman@naicapital.com
O: 818-742-1621
tmichelman@naicapital.com
While we strive to provide the most accurate information, all listing information, and demographic data, is provided by third-parties. As such, MyEListing will not be responsible for the accuracy of the information. It is strongly recommended that you verify all information with the listing agent, and any relevant agencies, prior to making any decisions.


