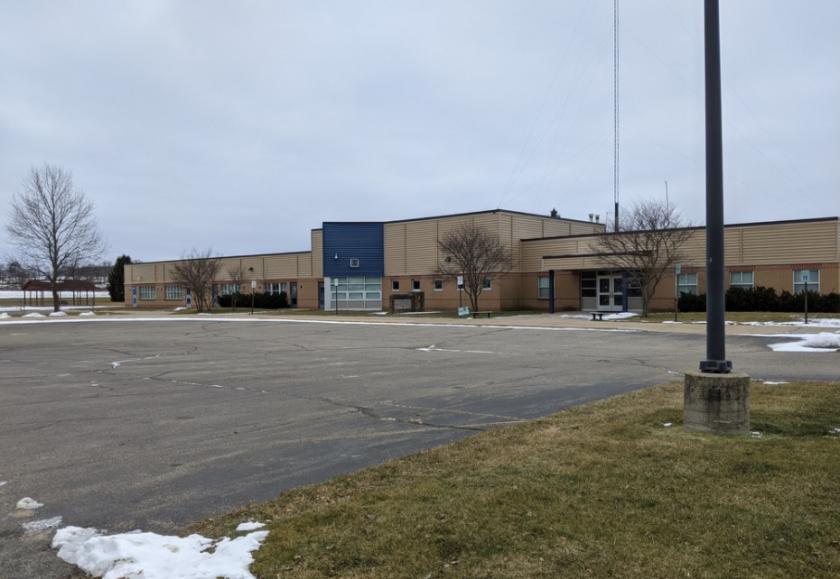
Specialty Real Estate
186 1st Street Clarksville, MI 48815
186 1st Street Clarksville, MI 48815
Details & Description
Property Highlights
- • Building expanded and renovated in 2008
- • Both properties can be purchased for $1,195,000
- • Rezoning complete for conceptual project
- • Building condition is like-new
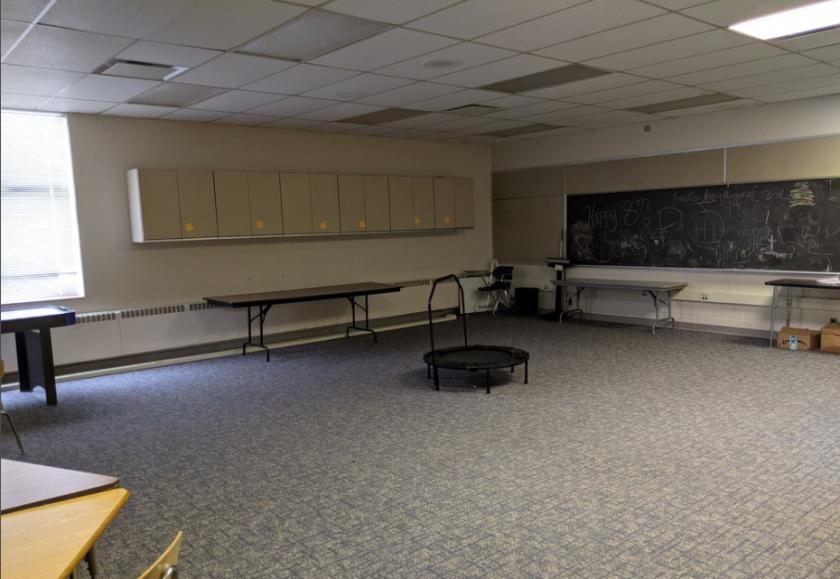
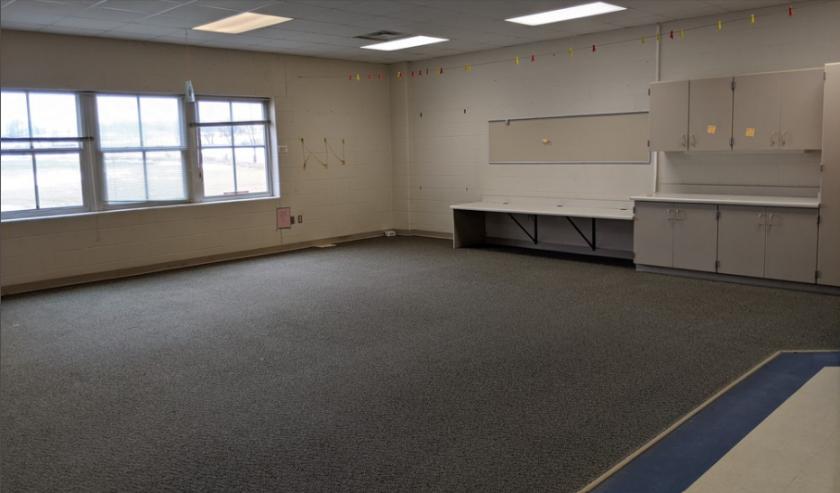
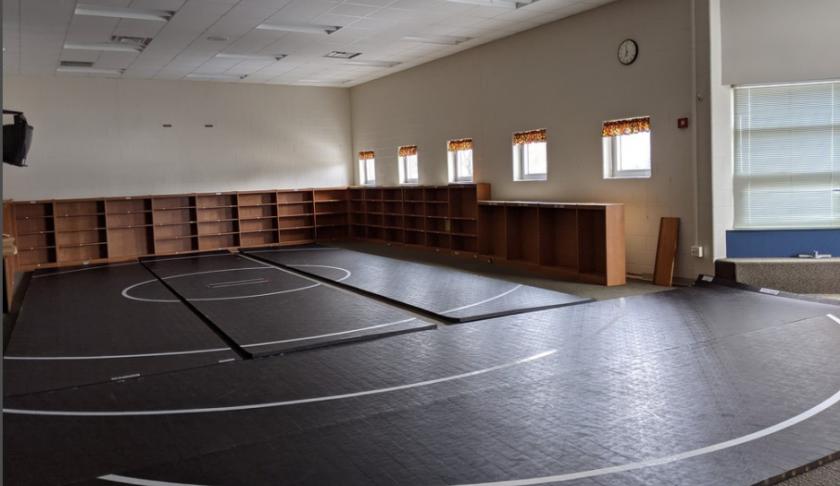
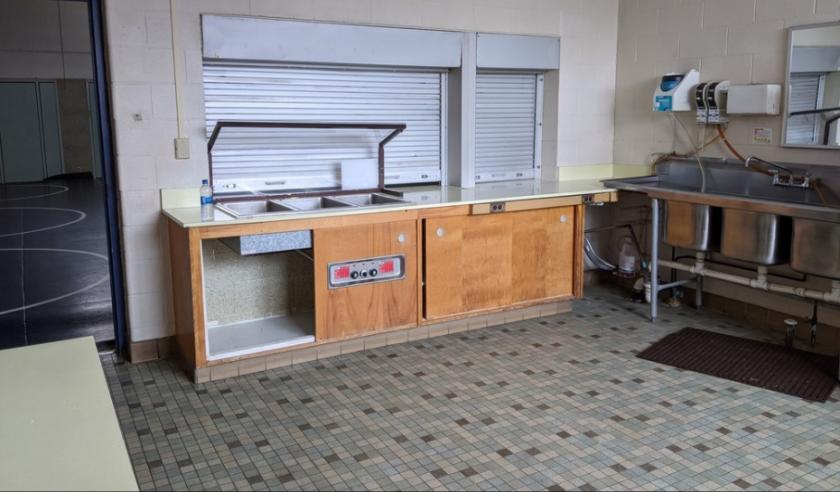
Additional Photos
Listing Agents

Dave Robinson
O: 517-487-9222
M: 517-599-6846
drobinson@naimidmichigan.com
O: 517-487-9222
M: 517-599-6846
drobinson@naimidmichigan.com
While we strive to provide the most accurate information, all listing information, and demographic data, is provided by third-parties. As such, MyEListing will not be responsible for the accuracy of the information. It is strongly recommended that you verify all information with the listing agent, and any relevant agencies, prior to making any decisions.


