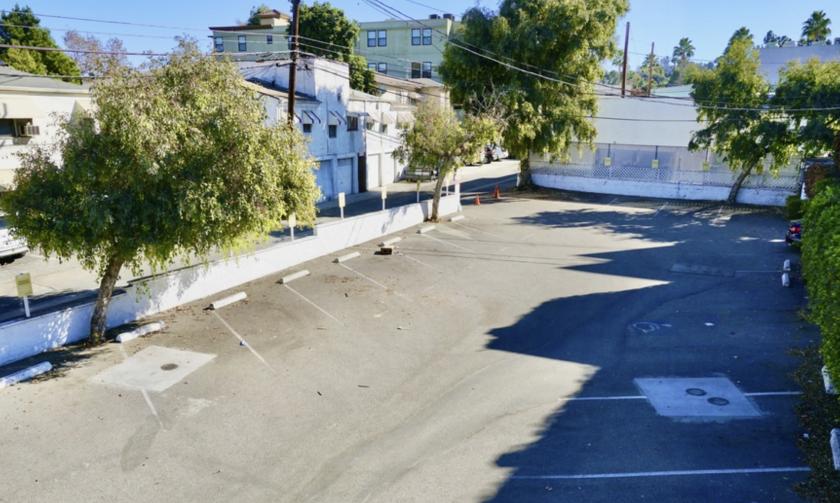
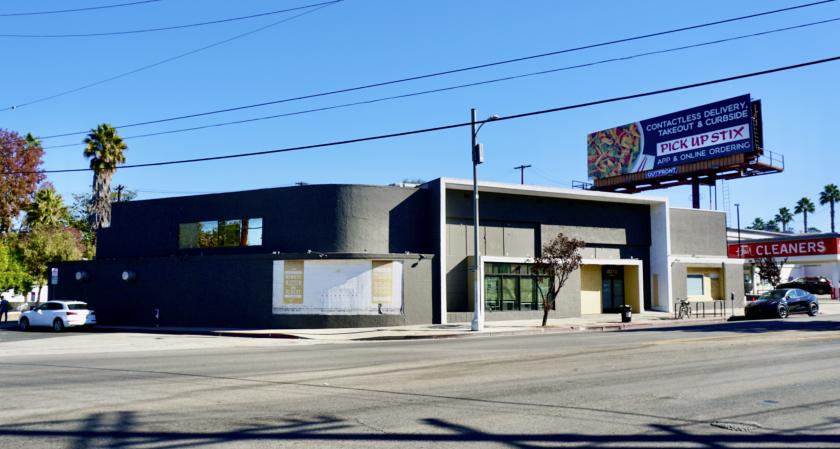
1-Mile | 3-Miles | 5-Miles | ||
---|---|---|---|---|
Total Population | 24,259 | 201,888 | 579,281 | |
Population Median Age | 41 | 40 | 39 | |
Population by Age | 0-9 Yrs | 2509 (10%) | 19355 (9%) | 54556 (9%) |
10-19 Yrs | 1763 (7%) | 15526 (7%) | 51378 (8%) | |
20-29 Yrs | 3111 (12%) | 34570 (17%) | 97585 (16%) | |
30-39 Yrs | 3944 (16%) | 37609 (18%) | 105663 (18%) | |
40-49 Yrs | 4327 (17%) | 28733 (14%) | 84934 (14%) | |
50-59 Yrs | 3076 (12%) | 26140 (12%) | 76033 (13%) | |
60-69 Yrs | 2847 (11%) | 21185 (10%) | 56556 (9%) | |
70+ Yrs | 2682 (11%) | 18770 (9%) | 52576 (9%) | |
Median HH Income | $108,641 | $79,358 | $71,876 | |
Total Household Income | < 24K | 1302 (12%) | 15429 (17%) | 47555 (19%) |
25-49K | 1536 (14%) | 14378 (16%) | 43987 (17%) | |
50-74K | 1022 (9%) | 12884 (14%) | 37128 (14%) | |
75-99K | 1150 (10%) | 10951 (12%) | 29359 (11%) | |
100-199K | 2968 (27%) | 21544 (24%) | 56039 (22%) | |
200K+ | 2769 (25%) | 14016 (15%) | 34487 (13%) | |
Highest Education Level | No Diploma | 845 | 12396 | 51982 |
Diploma or GED | 1817 | 19361 | 65622 | |
Some College | 3313 | 30592 | 83676 | |
Assoc. Degree | 1085 | 12059 | 32209 | |
Bachelors Degree | 7986 | 55194 | 138223 | |
Higher Degree | 3821 | 25358 | 66070 | |
Total Housing Units | 11,541 | 97,044 | 271,969 | |
--Owner-Occupied | 5,145 | 33,014 | 86,756 | |
--Renter-Occupied | 5,601 | 56,187 | 161,799 | |
Owner-Occupied Values | < 100K | 12 | 395 | 1162 |
100-199K | 38 | 245 | 679 | |
200-299K | 104 | 538 | 1769 | |
300-399K | 177 | 1373 | 4522 | |
400-499K | 263 | 2324 | 8499 | |
500K+ | 4551 | 28139 | 70125 | |
Total Working Age Population | 20,581 | 172,524 | 493,462 | |
In Work Force | 14,847 | 124,615 | 351,662 | |
Not In Work Force | 5,734 | 47,909 | 141,800 | |
Workforce Employed | 13,918 | 116,741 | 329,164 | |
Workforce Unemployed | 929 | 7,776 | 22,232 | |
Civlian Workforce | 14,847 | 124,517 | 351,397 | |
Military Workforce | 0 | 98 | 265 | |
Total Households | 10,746 | 89,201 | 248,555 | |
Family Households | 5,653 | 43,928 | 121,965 | |
Non-Family Households | 5,093 | 45,273 | 126,590 | |
Married Couple | 4,278 | 31,953 | 87,206 | |
Other Family | 1,375 | 11,975 | 34,759 | |
Married w/Child | 1,840 | 12,593 | 34,177 | |
Single Male w/Child | 176 | 1,327 | 3,711 | |
Single Female w/Child | 400 | 3,731 | 10,631 |
Population Change Last Two Decades - Plus Projection
2000 | % | 2010 | % | 2020 | % | 2030 | |
---|---|---|---|---|---|---|---|
California | 33,871,648 | +10 | 37,253,956 | +9 | 40,467,295 | +8 | 43,631,295 |
Los Angeles County | 9,519,338 | +3 | 9,818,605 | +6 | 10,369,367 | +4 | 10,759,850 |
Total Working Age Population:
Total Households:
Total Working Age Population:
Total Households:
Total Working Age Population:
Total Households: