Office Space
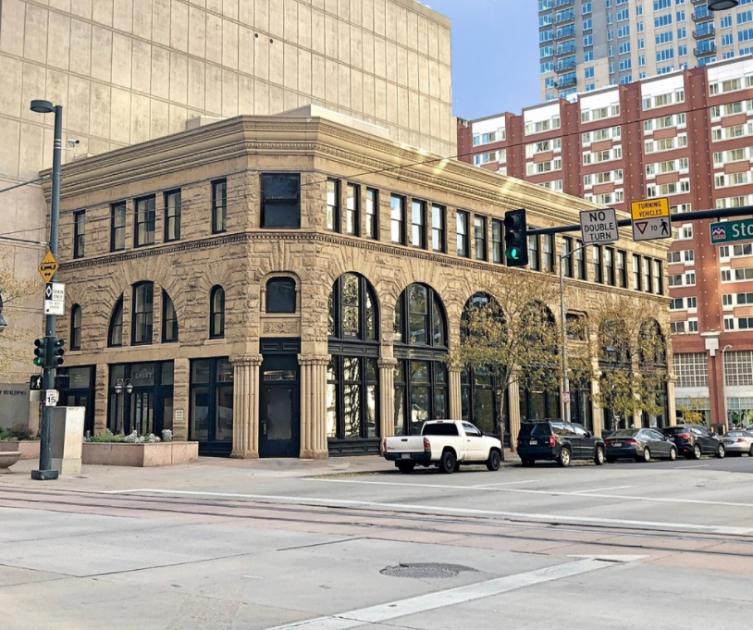
800 18th Street Denver, CO 80202
800 18th Street Denver, CO 80202
Details & Description
Property Highlights
• Premier downtown location surrounded by popular shopping, restaurants, hotels, and entertainment venues
• Close proximity to Coors Field, Union Station, 16th Street Mall, and the Colorado Convention Center
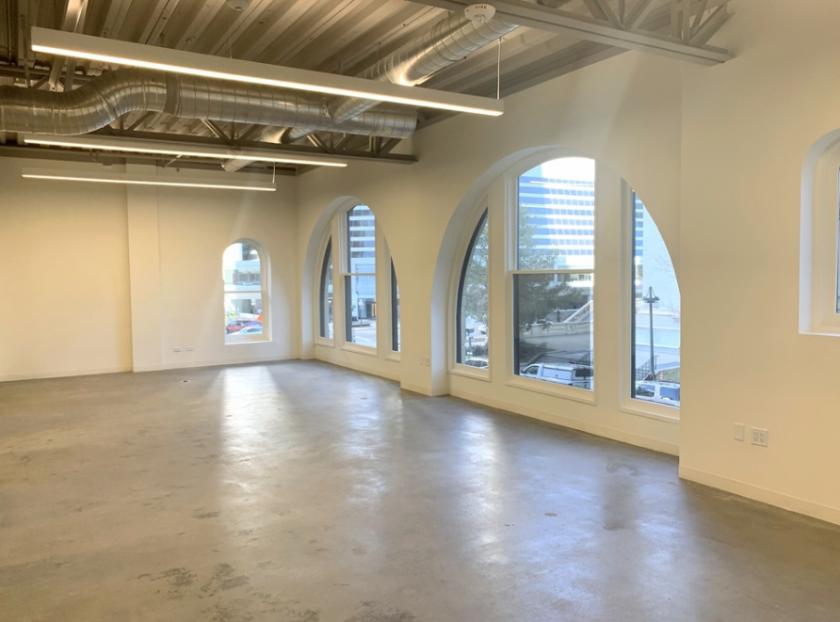
Additional Photos


Listing Agents

Kiley Crews
NAI - Shames Makovsky
O: 720-881-7542
M: 480-748-0444
kcrews@shamesmakovsky.com
NAI - Shames Makovsky
O: 720-881-7542
M: 480-748-0444
kcrews@shamesmakovsky.com
While we strive to provide the most accurate information, all listing information, and demographic data, is provided by third-parties. As such, MyEListing will not be responsible for the accuracy of the information. It is strongly recommended that you verify all information with the listing agent, and any relevant agencies, prior to making any decisions.


