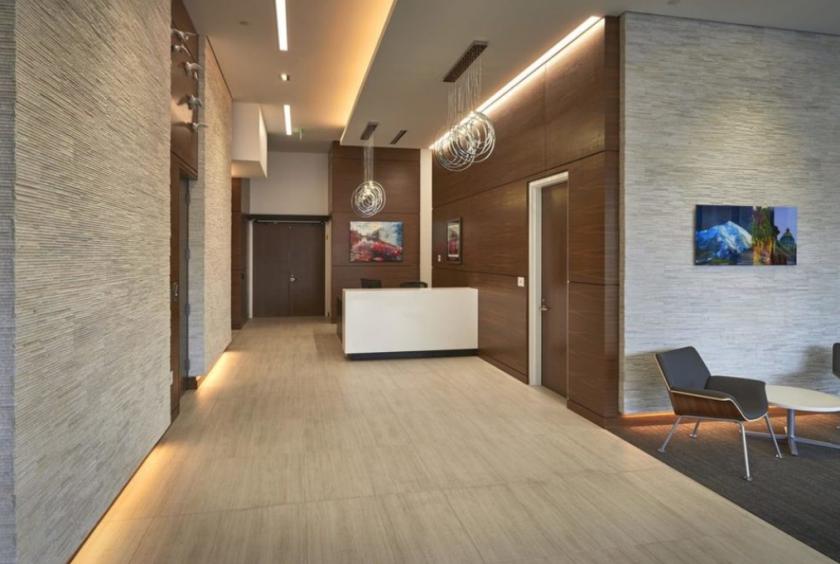
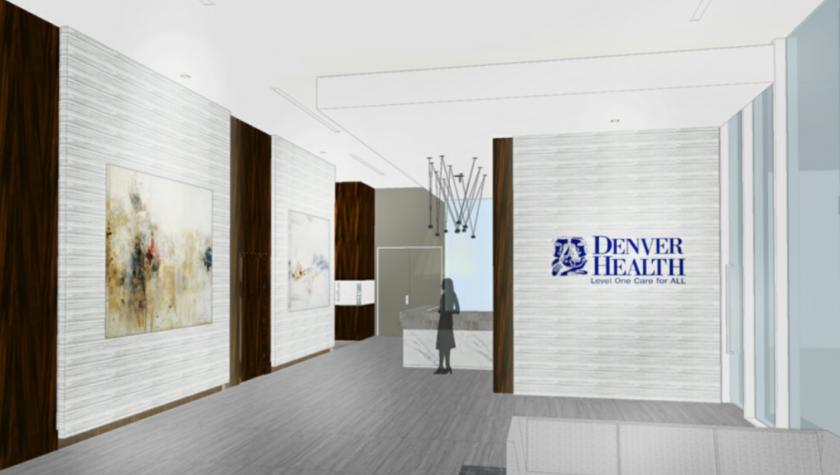
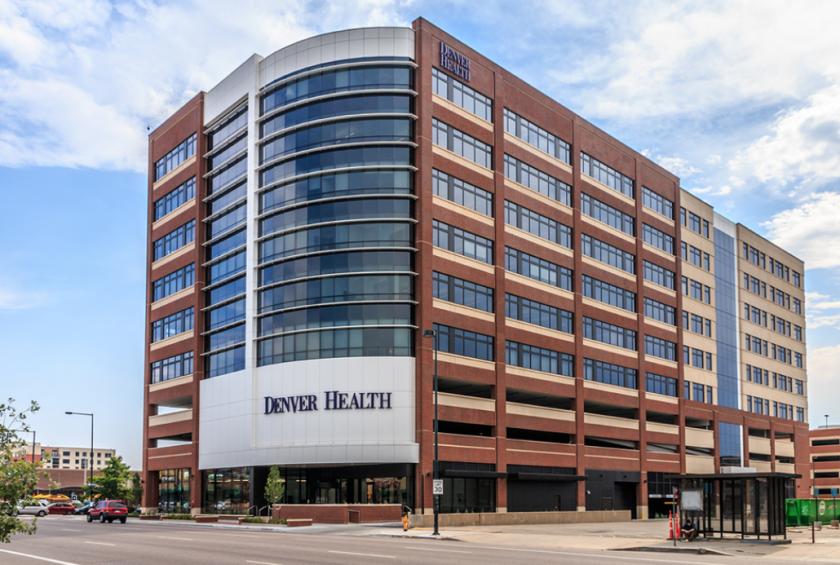
1-Mile | 3-Miles | 5-Miles | ||
---|---|---|---|---|
Total Population | 37,988 | 227,359 | 533,666 | |
Population Median Age | 38 | 37 | 37 | |
Population by Age | 0-9 Yrs | 1487 (3%) | 19840 (8%) | 56437 (10%) |
10-19 Yrs | 1168 (3%) | 16058 (7%) | 49953 (9%) | |
20-29 Yrs | 11182 (29%) | 51103 (22%) | 102773 (19%) | |
30-39 Yrs | 10763 (28%) | 53799 (23%) | 111811 (20%) | |
40-49 Yrs | 4021 (10%) | 28293 (12%) | 69334 (12%) | |
50-59 Yrs | 4085 (10%) | 23050 (10%) | 55152 (10%) | |
60-69 Yrs | 3415 (8%) | 20476 (9%) | 48350 (9%) | |
70+ Yrs | 1867 (4%) | 14739 (6%) | 39856 (7%) | |
Median HH Income | $61,549 | $69,565 | $67,272 | |
Total Household Income | < 24K | 4681 (19%) | 22019 (19%) | 44811 (18%) |
25-49K | 4884 (20%) | 19578 (17%) | 45137 (18%) | |
50-74K | 4457 (18%) | 18678 (16%) | 40337 (16%) | |
75-99K | 3026 (12%) | 13036 (11%) | 28058 (11%) | |
100-199K | 4843 (20%) | 26657 (23%) | 54567 (22%) | |
200K+ | 1570 (6%) | 13381 (11%) | 25227 (10%) | |
Highest Education Level | No Diploma | 1577 | 16791 | 45838 |
Diploma or GED | 3524 | 23491 | 64267 | |
Some College | 4809 | 24600 | 61637 | |
Assoc. Degree | 1525 | 7634 | 19148 | |
Bachelors Degree | 13580 | 64380 | 124179 | |
Higher Degree | 7751 | 40647 | 78109 | |
Total Housing Units | 25,081 | 123,461 | 255,751 | |
--Owner-Occupied | 6,679 | 44,337 | 110,243 | |
--Renter-Occupied | 16,781 | 69,012 | 127,893 | |
Owner-Occupied Values | < 100K | 222 | 913 | 2605 |
100-199K | 527 | 3735 | 9504 | |
200-299K | 1443 | 6557 | 18471 | |
300-399K | 1212 | 6974 | 20606 | |
400-499K | 1223 | 6229 | 17680 | |
500K+ | 2053 | 19929 | 41378 | |
Total Working Age Population | 36,017 | 198,095 | 447,645 | |
In Work Force | 29,493 | 150,938 | 327,835 | |
Not In Work Force | 6,524 | 47,156 | 119,810 | |
Workforce Employed | 28,246 | 144,945 | 314,580 | |
Workforce Unemployed | 1,229 | 5,932 | 13,033 | |
Civlian Workforce | 29,475 | 150,878 | 327,613 | |
Military Workforce | 18 | 60 | 222 | |
Total Households | 23,461 | 113,349 | 238,137 | |
Family Households | 4,977 | 40,958 | 106,706 | |
Non-Family Households | 18,483 | 72,391 | 131,431 | |
Married Couple | 3,854 | 30,069 | 75,789 | |
Other Family | 1,123 | 10,889 | 30,917 | |
Married w/Child | 814 | 10,642 | 30,861 | |
Single Male w/Child | 261 | 1,645 | 4,070 | |
Single Female w/Child | 238 | 3,704 | 10,928 |
Population Change Last Two Decades - Plus Projection
2000 | % | 2010 | % | 2020 | % | 2030 | |
---|---|---|---|---|---|---|---|
Colorado | 4,301,261 | +17 | 5,029,196 | +16 | 5,838,181 | +15 | 6,733,658 |
Adams County | 363,857 | +21 | 441,603 | +20 | 530,680 | +21 | 642,318 |
Arapahoe County | 487,967 | +17 | 572,003 | +16 | 662,304 | +13 | 750,773 |
Denver County | 554,636 | +8 | 600,158 | +23 | 738,611 | +12 | 827,681 |
Jefferson County | 527,056 | +1 | 534,543 | +10 | 587,118 | +7 | 626,742 |
Total Working Age Population:
Total Households:
Total Working Age Population:
Total Households:
Total Working Age Population:
Total Households: