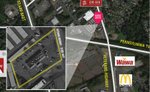
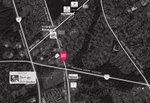
1-Mile | 3-Miles | 5-Miles | ||
---|---|---|---|---|
Total Population | 10,682 | 103,317 | 232,880 | |
Population Median Age | 40 | 40 | 40 | |
Population by Age | 0-9 Yrs | 1159 (10%) | 10998 (10%) | 26008 (11%) |
10-19 Yrs | 1112 (10%) | 12723 (12%) | 27246 (11%) | |
20-29 Yrs | 1571 (14%) | 14333 (13%) | 31629 (13%) | |
30-39 Yrs | 1603 (15%) | 13752 (13%) | 31245 (13%) | |
40-49 Yrs | 1376 (12%) | 13377 (12%) | 29452 (12%) | |
50-59 Yrs | 1606 (15%) | 15123 (14%) | 33713 (14%) | |
60-69 Yrs | 1249 (11%) | 13014 (12%) | 29016 (12%) | |
70+ Yrs | 1006 (9%) | 9998 (9%) | 24570 (10%) | |
Median HH Income | $63,088 | $71,174 | $71,216 | |
Total Household Income | < 24K | 718 (16%) | 5954 (15%) | 13794 (15%) |
25-49K | 910 (20%) | 7516 (19%) | 17160 (19%) | |
50-74K | 1001 (22%) | 6795 (17%) | 15394 (17%) | |
75-99K | 483 (11%) | 5551 (14%) | 12481 (14%) | |
100-199K | 1085 (24%) | 10729 (27%) | 23959 (27%) | |
200K+ | 174 (3%) | 1994 (5%) | 5448 (6%) | |
Highest Education Level | No Diploma | 710 | 6537 | 15115 |
Diploma or GED | 2759 | 27536 | 59806 | |
Some College | 1431 | 13335 | 30815 | |
Assoc. Degree | 637 | 6605 | 14192 | |
Bachelors Degree | 1314 | 11826 | 28584 | |
Higher Degree | 669 | 6356 | 15334 | |
Total Housing Units | 4,596 | 40,458 | 93,578 | |
--Owner-Occupied | 2,361 | 26,966 | 60,066 | |
--Renter-Occupied | 2,010 | 11,574 | 28,170 | |
Owner-Occupied Values | < 100K | 143 | 1470 | 3018 |
100-199K | 949 | 7616 | 15270 | |
200-299K | 981 | 12376 | 26028 | |
300-399K | 186 | 4018 | 10772 | |
400-499K | 72 | 975 | 3207 | |
500K+ | 30 | 511 | 1769 | |
Total Working Age Population | 8,837 | 84,795 | 190,783 | |
In Work Force | 6,417 | 58,667 | 130,579 | |
Not In Work Force | 2,420 | 26,128 | 60,204 | |
Workforce Employed | 5,997 | 55,344 | 123,123 | |
Workforce Unemployed | 419 | 3,173 | 7,144 | |
Civlian Workforce | 6,417 | 58,517 | 130,267 | |
Military Workforce | 0 | 150 | 312 | |
Total Households | 4,371 | 38,540 | 88,236 | |
Family Households | 2,695 | 26,096 | 59,271 | |
Non-Family Households | 1,676 | 12,443 | 28,964 | |
Married Couple | 1,776 | 18,642 | 43,185 | |
Other Family | 919 | 7,455 | 16,086 | |
Married w/Child | 600 | 7,172 | 16,195 | |
Single Male w/Child | 86 | 752 | 1,558 | |
Single Female w/Child | 336 | 2,435 | 5,696 |
Population Change Last Two Decades - Plus Projection
2000 | % | 2010 | % | 2020 | % | 2030 | |
---|---|---|---|---|---|---|---|
New Jersey | 8,414,350 | +4 | 8,791,894 | +4 | 9,132,700 | +4 | 9,530,900 |
Burlington County | 423,394 | +6 | 448,734 | 0 | 450,000 | +3 | 464,900 |
Mercer County | 350,761 | +4 | 366,513 | +3 | 379,000 | +5 | 397,400 |
Pennsylvania | 12,281,054 | +3 | 12,702,379 | +4 | 13,230,170 | +4 | 13,759,594 |
Bucks County | 597,635 | +5 | 625,249 | +1 | 629,420 | +1 | 637,730 |
Philadelphia County | 1,517,550 | +1 | 1,526,006 | +8 | 1,653,729 | +6 | 1,753,054 |
Total Working Age Population:
Total Households:
Total Working Age Population:
Total Households:
Total Working Age Population:
Total Households: