Retail Space
58 Steele Street Denver, CO 80206
58 Steele Street Denver, CO 80206

Details & Description
Property Highlights
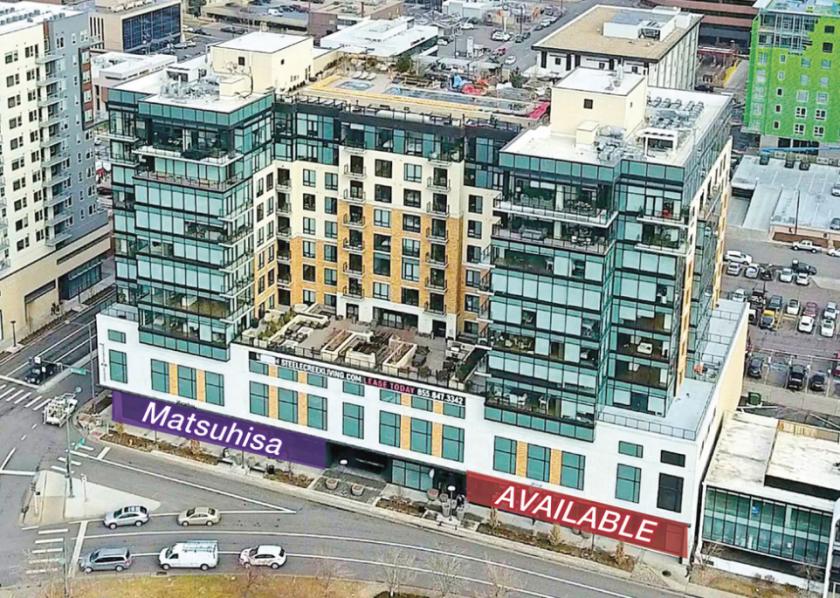
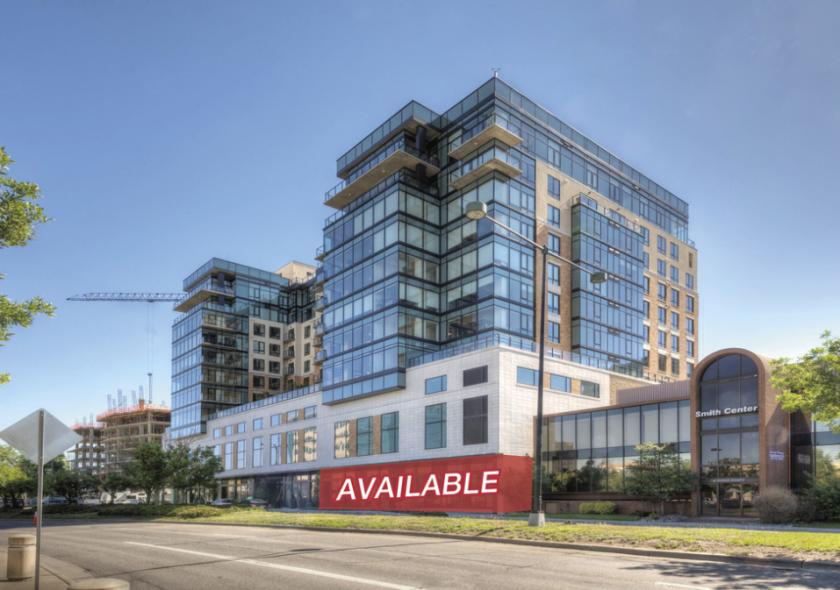
• Prime 6,000 SF street-level retail space on the ground floor of the 218 home Steele Creek luxury apartment building
• Join other upscale retailers that call Steele Creek home such as Matsuhisa, DryBar, Purluxe Beauty Bar
Listing Agents

Cory Dulberg
O: 303-565-3039
M: 303-319-1262
cdulberg@shamesmakovsky.com
O: 303-565-3039
M: 303-319-1262
cdulberg@shamesmakovsky.com
While we strive to provide the most accurate information, all listing information, and demographic data, is provided by third-parties. As such, MyEListing will not be responsible for the accuracy of the information. It is strongly recommended that you verify all information with the listing agent, and any relevant agencies, prior to making any decisions.