Retail Space
201 Columbine Street Denver, CO 80206
201 Columbine Street Denver, CO 80206

Details & Description
Property Highlights
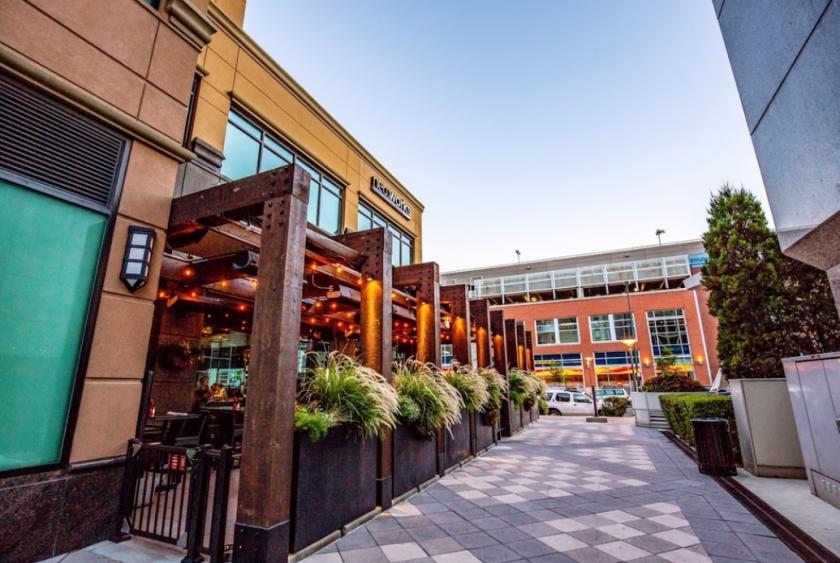
- • Turn-key restaurant space
- • Opportunity for building signage
- • Fully built-out kitchen dining areas
- • Abundant parking options
- • Top quality construction upscale finishes
- • Surrounded by luxury hotels
Listing Agents

Cory Dulberg
O: 303-565-3039
M: 303-319-1262
cdulberg@shamesmakovsky.com
O: 303-565-3039
M: 303-319-1262
cdulberg@shamesmakovsky.com
While we strive to provide the most accurate information, all listing information, and demographic data, is provided by third-parties. As such, MyEListing will not be responsible for the accuracy of the information. It is strongly recommended that you verify all information with the listing agent, and any relevant agencies, prior to making any decisions.