Retail Space
Route 73 and Walker Ave Berlin, NJ 08009
Route 73 and Walker Ave Berlin, NJ 08009
Details & Description
Property Highlights
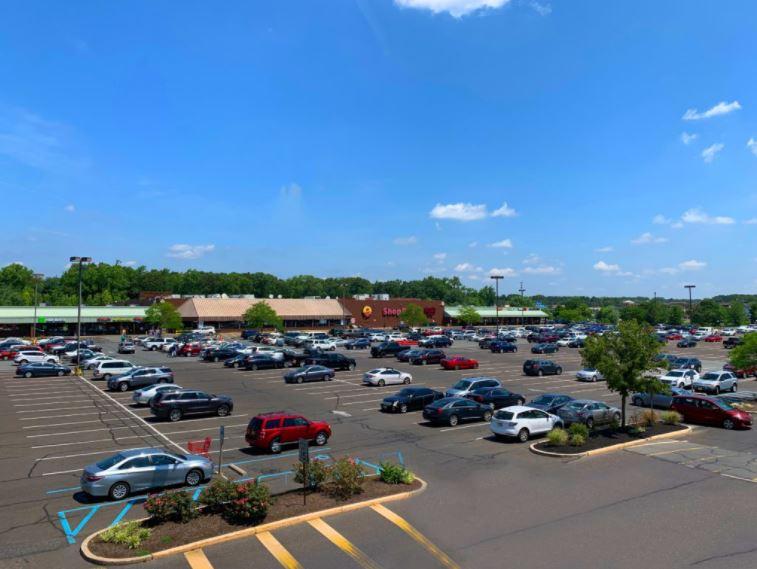
• Overabundance of parking allows for multiple same-day customer visits and longer duration stays
• Situated in the heart of the Berlin retail corridor on heavily trafficked Route-73 35,768 AADT
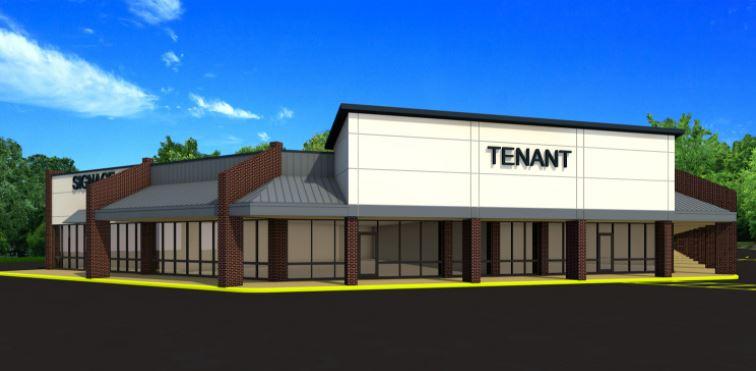
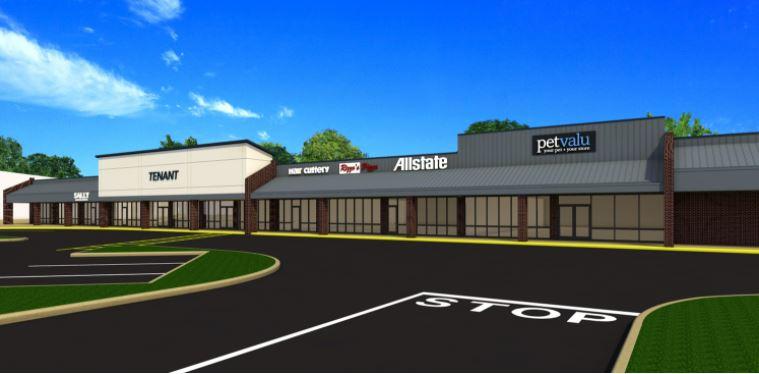
Additional Photos

Listing Agents

Joe Raniszewski
O: 215-883-7390
jraniszewski@hellomsc.com
O: 215-883-7390
jraniszewski@hellomsc.com

Leah Sweitzer
MSC
O: 310-622-4532
lsweitzer@hellomsc.com
MSC
O: 310-622-4532
lsweitzer@hellomsc.com
While we strive to provide the most accurate information, all listing information, and demographic data, is provided by third-parties. As such, MyEListing will not be responsible for the accuracy of the information. It is strongly recommended that you verify all information with the listing agent, and any relevant agencies, prior to making any decisions.


