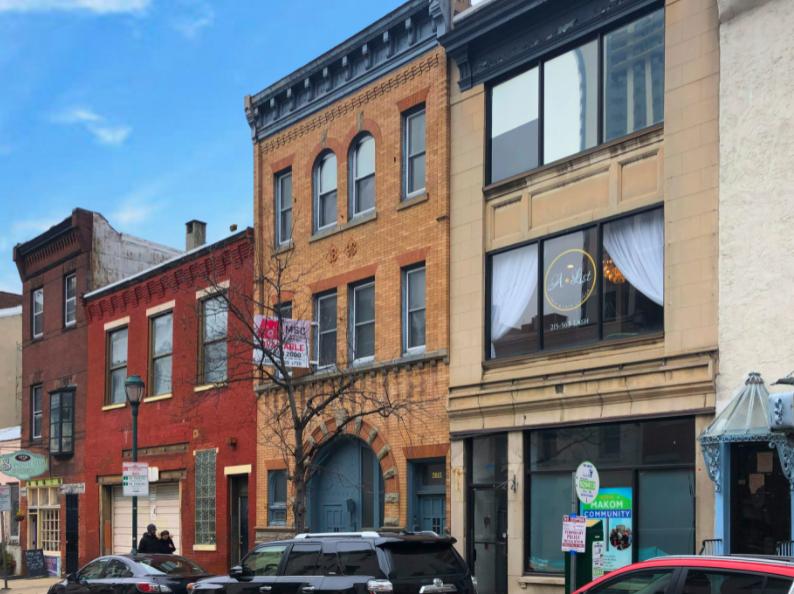
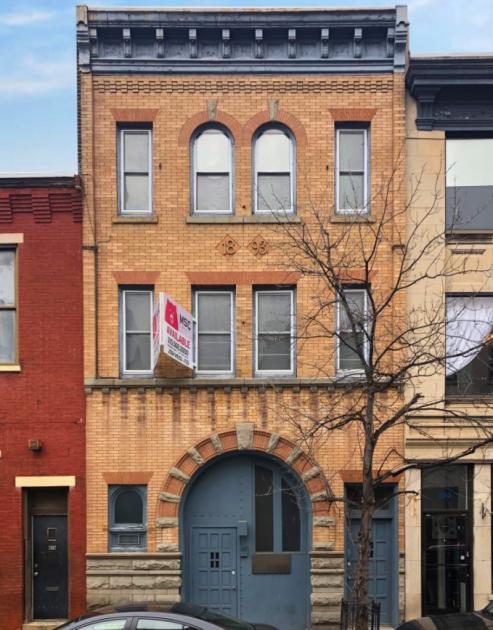
1-Mile | 3-Miles | 5-Miles | ||
---|---|---|---|---|
Total Population | 80,755 | 483,167 | 944,381 | |
Population Median Age | 38 | 37 | 36 | |
Population by Age | 0-9 Yrs | 4485 (5%) | 48065 (9%) | 115976 (12%) |
10-19 Yrs | 5046 (6%) | 51874 (10%) | 116406 (12%) | |
20-29 Yrs | 24591 (30%) | 111201 (23%) | 184431 (19%) | |
30-39 Yrs | 17981 (22%) | 89473 (18%) | 154390 (16%) | |
40-49 Yrs | 6985 (8%) | 48215 (9%) | 100924 (10%) | |
50-59 Yrs | 7214 (8%) | 49908 (10%) | 106134 (11%) | |
60-69 Yrs | 6958 (8%) | 44593 (9%) | 89328 (9%) | |
70+ Yrs | 7496 (9%) | 39838 (8%) | 76791 (8%) | |
Median HH Income | $81,544 | $53,227 | $42,654 | |
Total Household Income | < 24K | 7420 (17%) | 58112 (28%) | 124079 (33%) |
25-49K | 5695 (13%) | 37929 (18%) | 80243 (21%) | |
50-74K | 6513 (15%) | 30238 (15%) | 54700 (14%) | |
75-99K | 4962 (11%) | 20594 (10%) | 35624 (9%) | |
100-199K | 10301 (24%) | 36717 (18%) | 53556 (14%) | |
200K+ | 6963 (16%) | 17201 (8%) | 20712 (5%) | |
Highest Education Level | No Diploma | 2465 | 43486 | 105172 |
Diploma or GED | 5539 | 84931 | 191486 | |
Some College | 4938 | 44896 | 101537 | |
Assoc. Degree | 1779 | 14129 | 30485 | |
Bachelors Degree | 22606 | 79991 | 114488 | |
Higher Degree | 25882 | 71383 | 91644 | |
Total Housing Units | 47,962 | 235,762 | 434,145 | |
--Owner-Occupied | 14,657 | 88,239 | 172,119 | |
--Renter-Occupied | 27,198 | 112,553 | 196,793 | |
Owner-Occupied Values | < 100K | 513 | 15790 | 60819 |
100-199K | 952 | 18925 | 44346 | |
200-299K | 1888 | 17726 | 24917 | |
300-399K | 2641 | 12538 | 15313 | |
400-499K | 2126 | 7553 | 8976 | |
500K+ | 6538 | 15707 | 17748 | |
Total Working Age Population | 74,895 | 410,730 | 763,750 | |
In Work Force | 51,947 | 260,617 | 460,628 | |
Not In Work Force | 22,949 | 150,113 | 303,122 | |
Workforce Employed | 50,219 | 240,711 | 418,662 | |
Workforce Unemployed | 1,681 | 19,722 | 41,749 | |
Civlian Workforce | 51,900 | 260,433 | 460,410 | |
Military Workforce | 47 | 184 | 218 | |
Total Households | 41,854 | 200,792 | 368,913 | |
Family Households | 12,493 | 86,271 | 184,570 | |
Non-Family Households | 29,361 | 114,521 | 184,342 | |
Married Couple | 10,333 | 48,921 | 86,135 | |
Other Family | 2,160 | 37,349 | 98,436 | |
Married w/Child | 2,755 | 16,511 | 30,744 | |
Single Male w/Child | 198 | 2,965 | 8,315 | |
Single Female w/Child | 676 | 13,794 | 39,143 |
Population Change Last Two Decades - Plus Projection
2000 | % | 2010 | % | 2020 | % | 2030 | |
---|---|---|---|---|---|---|---|
New Jersey | 8,414,350 | +4 | 8,791,894 | +4 | 9,132,700 | +4 | 9,530,900 |
Camden County | 508,932 | +1 | 513,657 | 0 | 511,800 | +2 | 521,000 |
Gloucester County | 254,673 | +13 | 288,288 | +1 | 292,000 | +5 | 305,800 |
Pennsylvania | 12,281,054 | +3 | 12,702,379 | +4 | 13,230,170 | +4 | 13,759,594 |
Delaware County | 550,864 | +1 | 558,979 | +5 | 588,436 | +6 | 622,307 |
Montgomery County | 750,097 | +7 | 799,874 | +5 | 838,883 | +6 | 891,868 |
Philadelphia County | 1,517,550 | +1 | 1,526,006 | +8 | 1,653,729 | +6 | 1,753,054 |
Total Working Age Population:
Total Households:
Total Working Age Population:
Total Households:
Total Working Age Population:
Total Households: