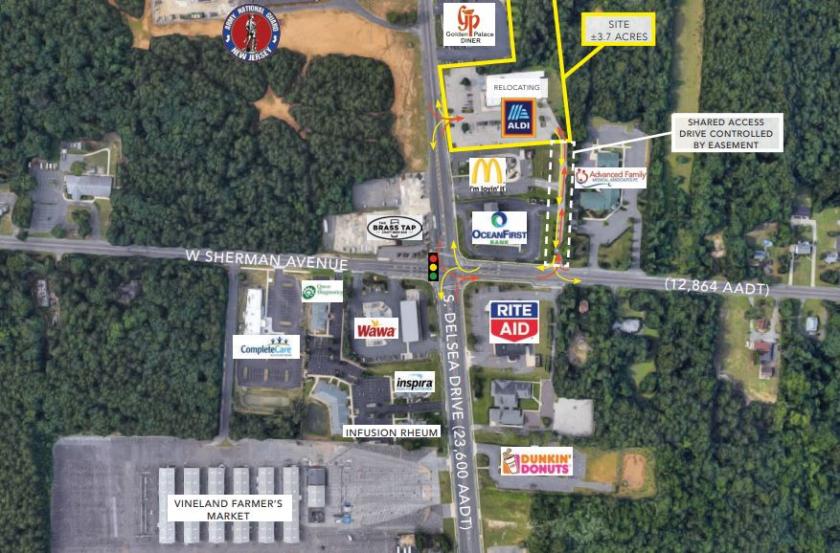
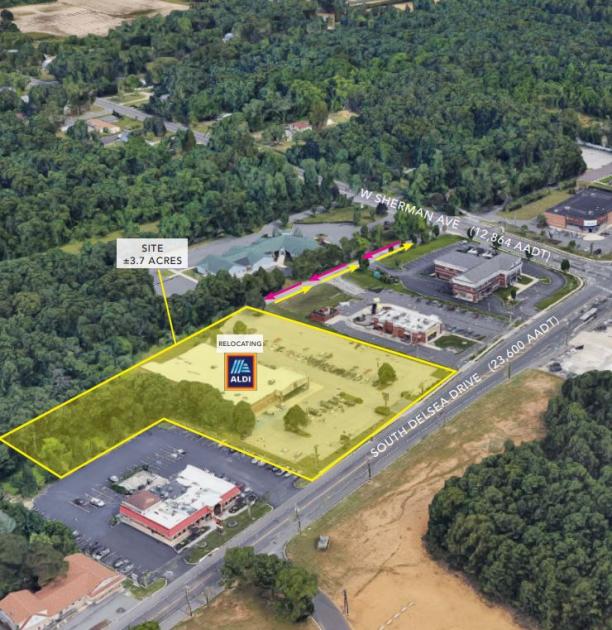
1-Mile | 3-Miles | 5-Miles | ||
---|---|---|---|---|
Total Population | 1,361 | 32,287 | 77,810 | |
Population Median Age | 41 | 38 | 38 | |
Population by Age | 0-9 Yrs | 164 (12%) | 4453 (13%) | 10620 (13%) |
10-19 Yrs | 147 (10%) | 4299 (13%) | 10509 (13%) | |
20-29 Yrs | 172 (12%) | 4283 (13%) | 9991 (12%) | |
30-39 Yrs | 214 (15%) | 4049 (12%) | 9556 (12%) | |
40-49 Yrs | 112 (8%) | 3779 (11%) | 9873 (12%) | |
50-59 Yrs | 202 (14%) | 4229 (13%) | 10290 (13%) | |
60-69 Yrs | 189 (13%) | 3454 (10%) | 8282 (10%) | |
70+ Yrs | 162 (11%) | 3741 (11%) | 8690 (11%) | |
Median HH Income | $83,682 | $47,258 | $54,996 | |
Total Household Income | < 24K | 64 (15%) | 3449 (29%) | 6773 (24%) |
25-49K | 68 (16%) | 2762 (23%) | 6052 (21%) | |
50-74K | 56 (13%) | 2011 (17%) | 5304 (18%) | |
75-99K | 66 (15%) | 1104 (9%) | 3092 (11%) | |
100-199K | 117 (27%) | 2035 (17%) | 5749 (20%) | |
200K+ | 50 (11%) | 466 (3%) | 1048 (3%) | |
Highest Education Level | No Diploma | 243 | 5283 | 10839 |
Diploma or GED | 307 | 7050 | 18282 | |
Some College | 210 | 3873 | 9115 | |
Assoc. Degree | 61 | 1413 | 3894 | |
Bachelors Degree | 112 | 2603 | 6789 | |
Higher Degree | 44 | 1113 | 2900 | |
Total Housing Units | 429 | 12,513 | 30,702 | |
--Owner-Occupied | 348 | 6,293 | 17,645 | |
--Renter-Occupied | 72 | 5,533 | 10,373 | |
Owner-Occupied Values | < 100K | 49 | 832 | 2744 |
100-199K | 159 | 3536 | 9181 | |
200-299K | 103 | 1339 | 4180 | |
300-399K | 23 | 364 | 920 | |
400-499K | 0 | 58 | 235 | |
500K+ | 14 | 163 | 386 | |
Total Working Age Population | 1,101 | 25,149 | 60,691 | |
In Work Force | 705 | 15,335 | 36,805 | |
Not In Work Force | 396 | 9,814 | 23,885 | |
Workforce Employed | 661 | 14,059 | 34,018 | |
Workforce Unemployed | 44 | 1,266 | 2,749 | |
Civlian Workforce | 705 | 15,325 | 36,767 | |
Military Workforce | 0 | 10 | 38 | |
Total Households | 420 | 11,826 | 28,018 | |
Family Households | 306 | 7,767 | 19,047 | |
Non-Family Households | 114 | 4,058 | 8,972 | |
Married Couple | 200 | 4,564 | 11,700 | |
Other Family | 106 | 3,204 | 7,347 | |
Married w/Child | 92 | 1,824 | 4,516 | |
Single Male w/Child | 17 | 485 | 993 | |
Single Female w/Child | 16 | 1,297 | 2,839 |
Population Change Last Two Decades - Plus Projection
2000 | % | 2010 | % | 2020 | % | 2030 | |
---|---|---|---|---|---|---|---|
New Jersey | 8,414,350 | +4 | 8,791,894 | +4 | 9,132,700 | +4 | 9,530,900 |
Atlantic County | 252,552 | +9 | 274,549 | +1 | 276,200 | +2 | 280,600 |
Cumberland County | 146,438 | +7 | 156,898 | +1 | 158,600 | +2 | 162,000 |
Gloucester County | 254,673 | +13 | 288,288 | +1 | 292,000 | +5 | 305,800 |
Salem County | 64,285 | +3 | 66,083 | -5 | 63,000 | -3 | 61,000 |
Total Working Age Population:
Total Households:
Total Working Age Population:
Total Households:
Total Working Age Population:
Total Households: