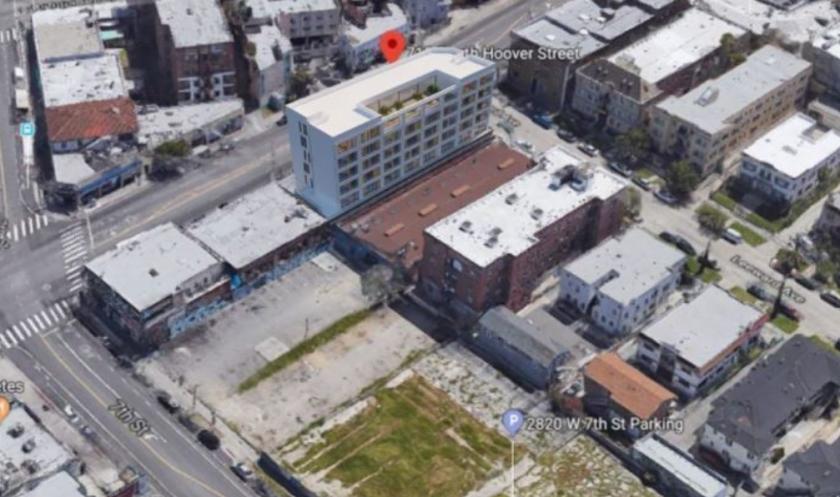
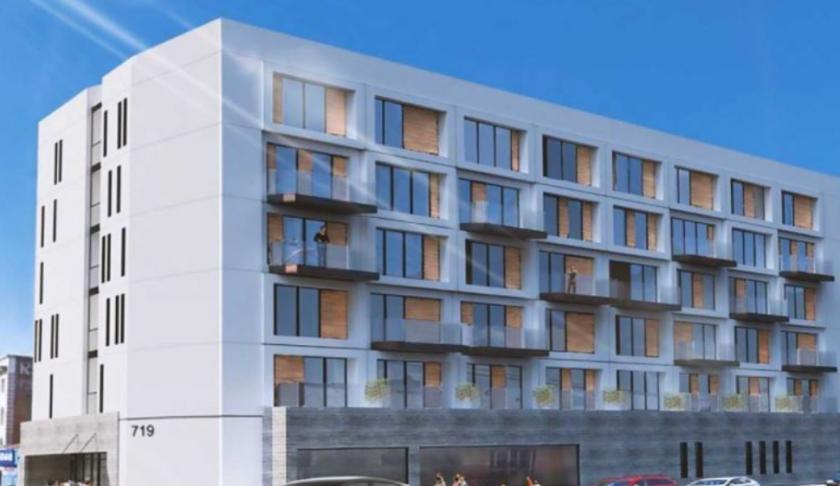
1-Mile | 3-Miles | 5-Miles | ||
---|---|---|---|---|
Total Population | 141,336 | 609,728 | 1,270,018 | |
Population Median Age | 35 | 37 | 37 | |
Population by Age | 0-9 Yrs | 18036 (12%) | 62549 (10%) | 139253 (10%) |
10-19 Yrs | 15164 (10%) | 64525 (10%) | 139322 (10%) | |
20-29 Yrs | 26559 (18%) | 124771 (20%) | 244241 (19%) | |
30-39 Yrs | 26932 (19%) | 111796 (18%) | 226039 (17%) | |
40-49 Yrs | 18824 (13%) | 80401 (13%) | 175355 (13%) | |
50-59 Yrs | 15258 (10%) | 68621 (11%) | 144394 (11%) | |
60-69 Yrs | 10697 (7%) | 51446 (8%) | 106489 (8%) | |
70+ Yrs | 9865 (6%) | 45620 (7%) | 94926 (7%) | |
Median HH Income | $37,261 | $43,131 | $48,044 | |
Total Household Income | < 24K | 17043 (32%) | 70002 (30%) | 129837 (28%) |
25-49K | 15866 (30%) | 56615 (24%) | 108763 (23%) | |
50-74K | 9167 (17%) | 35874 (15%) | 74210 (16%) | |
75-99K | 4599 (8%) | 21796 (9%) | 47648 (10%) | |
100-199K | 4420 (8%) | 31438 (13%) | 74972 (16%) | |
200K+ | 684 (1%) | 11236 (4%) | 27808 (6%) | |
Highest Education Level | No Diploma | 37455 | 125661 | 254427 |
Diploma or GED | 19921 | 84508 | 170317 | |
Some College | 12482 | 62745 | 138959 | |
Assoc. Degree | 5097 | 22167 | 47214 | |
Bachelors Degree | 17842 | 95948 | 192078 | |
Higher Degree | 5104 | 37067 | 83167 | |
Total Housing Units | 56,457 | 249,932 | 508,410 | |
--Owner-Occupied | 1,923 | 28,789 | 89,506 | |
--Renter-Occupied | 49,856 | 198,172 | 373,732 | |
Owner-Occupied Values | < 100K | 70 | 544 | 1547 |
100-199K | 80 | 434 | 1633 | |
200-299K | 77 | 986 | 4669 | |
300-399K | 328 | 2082 | 9624 | |
400-499K | 339 | 2341 | 10551 | |
500K+ | 1028 | 22401 | 61482 | |
Total Working Age Population | 114,110 | 512,616 | 1,050,640 | |
In Work Force | 80,892 | 342,722 | 703,211 | |
Not In Work Force | 33,218 | 169,895 | 347,429 | |
Workforce Employed | 75,252 | 319,366 | 654,471 | |
Workforce Unemployed | 5,619 | 23,286 | 48,535 | |
Civlian Workforce | 80,872 | 342,652 | 703,006 | |
Military Workforce | 20 | 70 | 205 | |
Total Households | 51,779 | 226,961 | 463,239 | |
Family Households | 28,171 | 113,653 | 240,085 | |
Non-Family Households | 23,608 | 113,308 | 223,153 | |
Married Couple | 14,577 | 65,472 | 140,770 | |
Other Family | 13,593 | 48,181 | 99,315 | |
Married w/Child | 6,620 | 26,160 | 57,636 | |
Single Male w/Child | 1,983 | 6,251 | 12,991 | |
Single Female w/Child | 4,227 | 14,405 | 30,343 |
Population Change Last Two Decades - Plus Projection
2000 | % | 2010 | % | 2020 | % | 2030 | |
---|---|---|---|---|---|---|---|
California | 33,871,648 | +10 | 37,253,956 | +9 | 40,467,295 | +8 | 43,631,295 |
Los Angeles County | 9,519,338 | +3 | 9,818,605 | +6 | 10,369,367 | +4 | 10,759,850 |
Total Working Age Population:
Total Households:
Total Working Age Population:
Total Households:
Total Working Age Population:
Total Households: