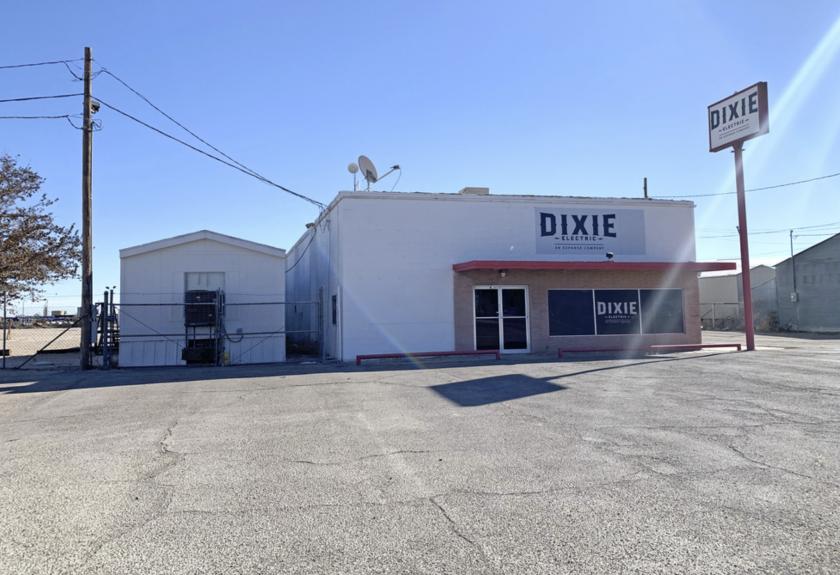
Flex-Office-Warehouse
3000 South Stockton Avenue Monahans, TX 79756
3000 South Stockton Avenue Monahans, TX 79756
Details & Description
Property Highlights
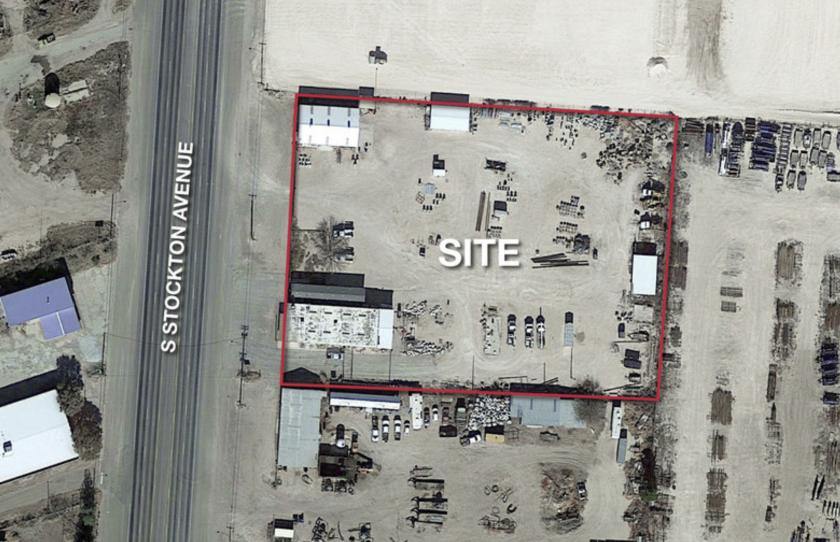
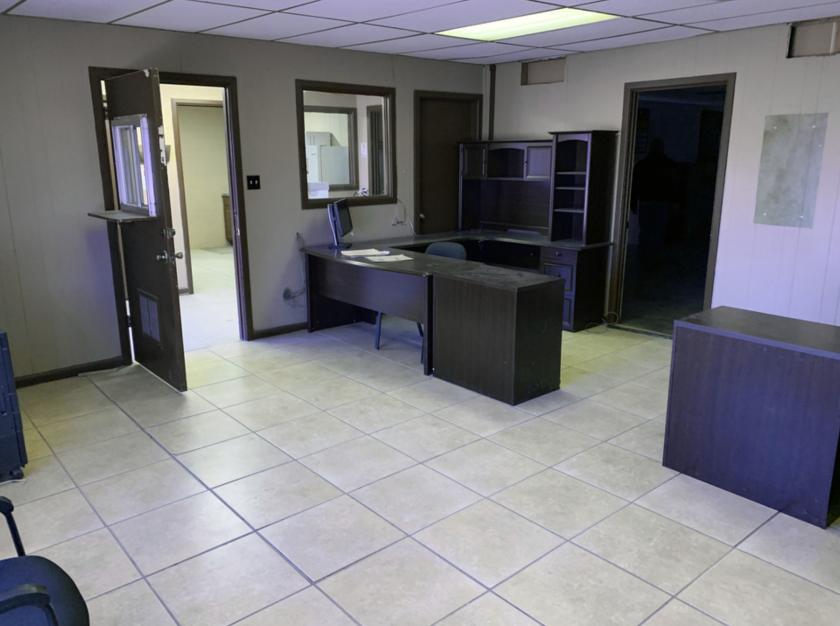
- • 2,915 SF Office
- • 7,850 SF WarehouseShop
- • 3 storage buildings
- • Other amenities on the property include
- • 2 2-ton cranes
- • 1 1 12 ton crane
Additional Photos


Listing Agents

Joe Magby
O: 806-722-1200
M: 806-200-3244
joe@naiwheelhouse.com
O: 806-722-1200
M: 806-200-3244
joe@naiwheelhouse.com
While we strive to provide the most accurate information, all listing information, and demographic data, is provided by third-parties. As such, MyEListing will not be responsible for the accuracy of the information. It is strongly recommended that you verify all information with the listing agent, and any relevant agencies, prior to making any decisions.


