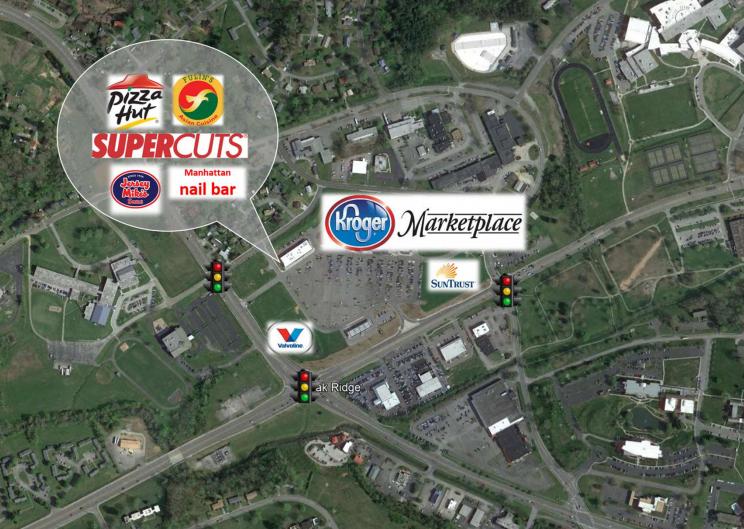
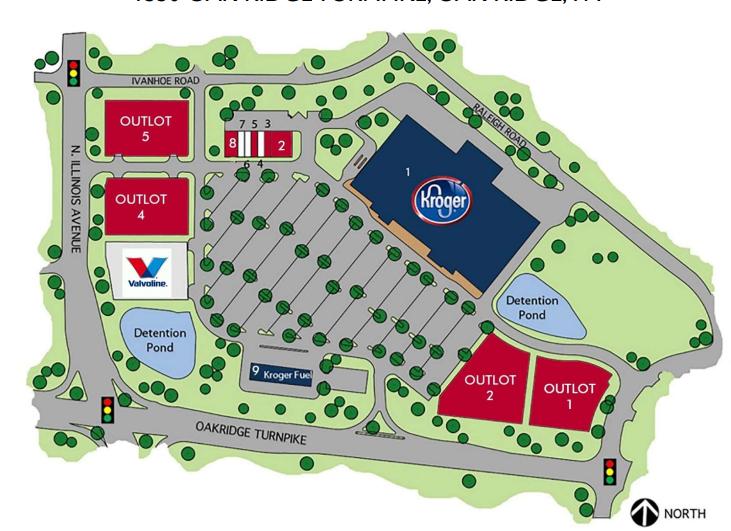
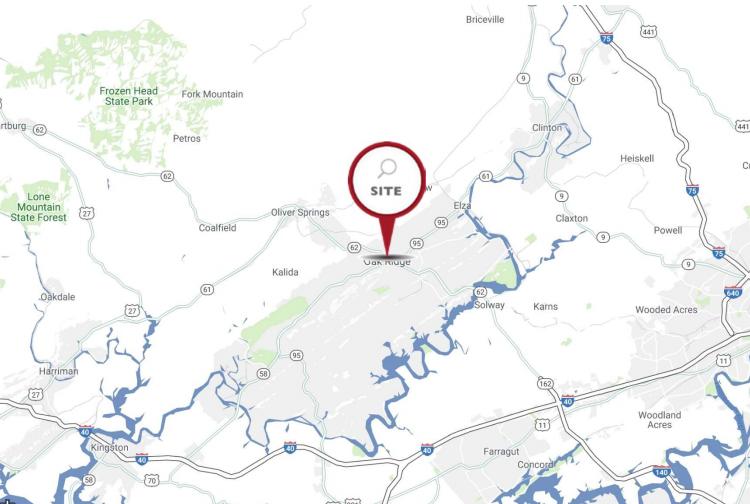
1-Mile | 3-Miles | 5-Miles | ||
---|---|---|---|---|
Total Population | 4,382 | 20,933 | 36,508 | |
Population Median Age | 39 | 40 | 40 | |
Population by Age | 0-9 Yrs | 524 (11%) | 2564 (12%) | 4177 (11%) |
10-19 Yrs | 562 (12%) | 2434 (11%) | 4732 (12%) | |
20-29 Yrs | 681 (15%) | 3058 (14%) | 4613 (12%) | |
30-39 Yrs | 545 (12%) | 2486 (11%) | 4348 (11%) | |
40-49 Yrs | 496 (11%) | 2574 (12%) | 4577 (12%) | |
50-59 Yrs | 586 (13%) | 2588 (12%) | 4843 (13%) | |
60-69 Yrs | 482 (10%) | 2586 (12%) | 4602 (12%) | |
70+ Yrs | 507 (11%) | 2643 (12%) | 4617 (12%) | |
Median HH Income | $37,598 | $45,003 | $55,612 | |
Total Household Income | < 24K | 683 (35%) | 2379 (27%) | 3332 (22%) |
25-49K | 563 (29%) | 2338 (26%) | 3383 (22%) | |
50-74K | 369 (19%) | 1837 (20%) | 2938 (19%) | |
75-99K | 150 (7%) | 872 (9%) | 1633 (11%) | |
100-199K | 143 (7%) | 1164 (13%) | 2851 (19%) | |
200K+ | 14 (0%) | 197 (2%) | 694 (4%) | |
Highest Education Level | No Diploma | 343 | 1501 | 2240 |
Diploma or GED | 1000 | 4318 | 6611 | |
Some College | 718 | 3571 | 5992 | |
Assoc. Degree | 303 | 1275 | 2141 | |
Bachelors Degree | 398 | 2103 | 4427 | |
Higher Degree | 224 | 1826 | 3967 | |
Total Housing Units | 2,332 | 10,336 | 17,057 | |
--Owner-Occupied | 901 | 5,009 | 9,694 | |
--Renter-Occupied | 1,019 | 3,778 | 5,137 | |
Owner-Occupied Values | < 100K | 417 | 1691 | 2511 |
100-199K | 437 | 2500 | 4233 | |
200-299K | 22 | 531 | 1715 | |
300-399K | 11 | 180 | 659 | |
400-499K | 12 | 65 | 289 | |
500K+ | 3 | 40 | 289 | |
Total Working Age Population | 3,528 | 16,830 | 29,083 | |
In Work Force | 2,064 | 9,722 | 17,022 | |
Not In Work Force | 1,464 | 7,107 | 12,061 | |
Workforce Employed | 1,841 | 9,100 | 16,170 | |
Workforce Unemployed | 223 | 615 | 843 | |
Civlian Workforce | 2,064 | 9,715 | 17,013 | |
Military Workforce | 0 | 7 | 9 | |
Total Households | 1,921 | 8,787 | 14,831 | |
Family Households | 1,058 | 5,287 | 9,555 | |
Non-Family Households | 863 | 3,500 | 5,276 | |
Married Couple | 539 | 3,371 | 6,825 | |
Other Family | 518 | 1,915 | 2,730 | |
Married w/Child | 199 | 1,228 | 2,509 | |
Single Male w/Child | 46 | 204 | 320 | |
Single Female w/Child | 282 | 888 | 1,240 |
Population Change Last Two Decades - Plus Projection
2000 | % | 2010 | % | 2020 | % | 2030 | |
---|---|---|---|---|---|---|---|
Tennessee | 5,689,283 | +12 | 6,346,105 | +9 | 6,886,369 | +7 | 7,393,069 |
Anderson County | 71,330 | +5 | 75,129 | +3 | 77,151 | +3 | 79,454 |
Knox County | 382,032 | +13 | 432,226 | +10 | 473,996 | +8 | 513,318 |
Morgan County | 19,757 | +11 | 21,987 | -1 | 21,754 | +3 | 22,300 |
Roane County | 51,910 | +4 | 54,181 | -2 | 53,285 | 0 | 53,111 |
Total Working Age Population:
Total Households:
Total Working Age Population:
Total Households:
Total Working Age Population:
Total Households: