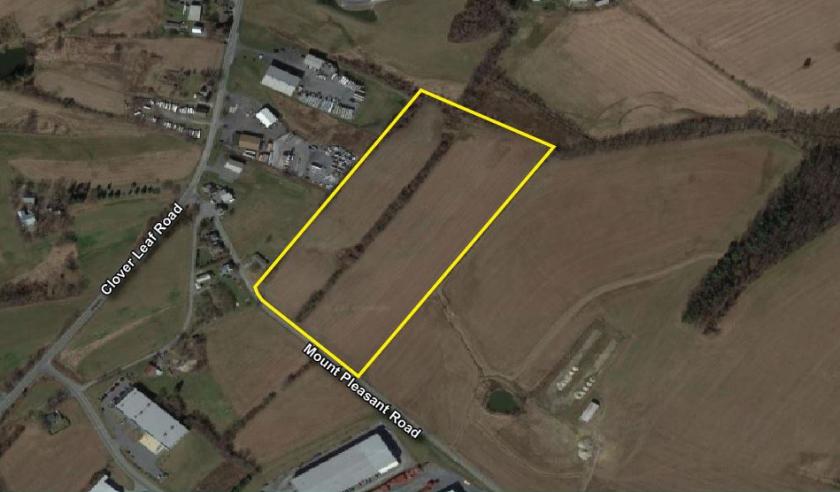
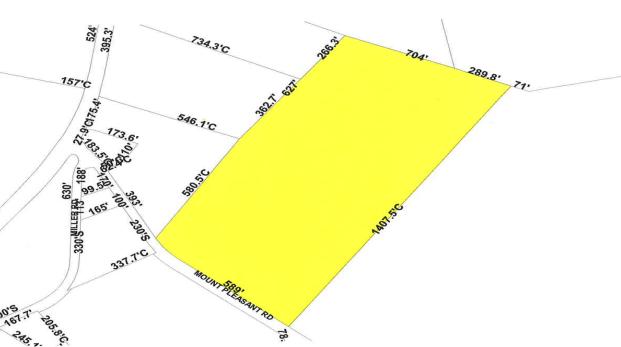
1-Mile | 3-Miles | 5-Miles | ||
---|---|---|---|---|
Total Population | 1,602 | 23,369 | 47,235 | |
Population Median Age | 36 | 38 | 40 | |
Population by Age | 0-9 Yrs | 246 (15%) | 2914 (12%) | 5669 (12%) |
10-19 Yrs | 115 (7%) | 3045 (13%) | 5521 (11%) | |
20-29 Yrs | 310 (19%) | 3764 (16%) | 6528 (13%) | |
30-39 Yrs | 248 (15%) | 3200 (13%) | 6181 (13%) | |
40-49 Yrs | 178 (11%) | 2475 (10%) | 4974 (10%) | |
50-59 Yrs | 276 (17%) | 3412 (14%) | 7016 (14%) | |
60-69 Yrs | 154 (9%) | 2475 (10%) | 5416 (11%) | |
70+ Yrs | 76 (4%) | 2084 (8%) | 5931 (12%) | |
Median HH Income | $74,085 | $73,668 | $70,425 | |
Total Household Income | < 24K | 12 (1%) | 660 (7%) | 1764 (9%) |
25-49K | 102 (16%) | 1719 (20%) | 3921 (21%) | |
50-74K | 196 (32%) | 1965 (23%) | 4098 (22%) | |
75-99K | 112 (18%) | 1465 (17%) | 3077 (16%) | |
100-199K | 161 (26%) | 2249 (26%) | 4281 (23%) | |
200K+ | 19 (3%) | 425 (5%) | 981 (5%) | |
Highest Education Level | No Diploma | 80 | 1054 | 2507 |
Diploma or GED | 332 | 5666 | 12590 | |
Some College | 274 | 2864 | 5425 | |
Assoc. Degree | 66 | 1359 | 3020 | |
Bachelors Degree | 298 | 2782 | 5702 | |
Higher Degree | 83 | 1642 | 3589 | |
Total Housing Units | 603 | 8,777 | 18,814 | |
--Owner-Occupied | 397 | 5,684 | 12,205 | |
--Renter-Occupied | 205 | 2,799 | 5,917 | |
Owner-Occupied Values | < 100K | 32 | 263 | 872 |
100-199K | 123 | 2361 | 4970 | |
200-299K | 186 | 2272 | 4507 | |
300-399K | 45 | 467 | 1121 | |
400-499K | 1 | 203 | 359 | |
500K+ | 10 | 117 | 376 | |
Total Working Age Population | 1,264 | 19,062 | 38,712 | |
In Work Force | 1,008 | 13,574 | 25,967 | |
Not In Work Force | 256 | 5,488 | 12,745 | |
Workforce Employed | 993 | 13,145 | 25,074 | |
Workforce Unemployed | 16 | 416 | 874 | |
Civlian Workforce | 1,008 | 13,561 | 25,948 | |
Military Workforce | 0 | 13 | 18 | |
Total Households | 603 | 8,483 | 18,122 | |
Family Households | 463 | 6,194 | 12,998 | |
Non-Family Households | 139 | 2,289 | 5,125 | |
Married Couple | 408 | 5,125 | 10,455 | |
Other Family | 55 | 1,070 | 2,543 | |
Married w/Child | 150 | 1,874 | 3,432 | |
Single Male w/Child | 14 | 222 | 503 | |
Single Female w/Child | 1 | 303 | 671 |
Population Change Last Two Decades - Plus Projection
2000 | % | 2010 | % | 2020 | % | 2030 | |
---|---|---|---|---|---|---|---|
Pennsylvania | 12,281,054 | +3 | 12,702,379 | +4 | 13,230,170 | +4 | 13,759,594 |
Dauphin County | 251,798 | +6 | 268,100 | +4 | 279,506 | +3 | 289,132 |
Lancaster County | 470,658 | +10 | 519,445 | +8 | 559,247 | +8 | 602,153 |
Lebanon County | 120,327 | +11 | 133,568 | +4 | 139,272 | +5 | 145,663 |
York County | 381,751 | +14 | 434,972 | +6 | 460,514 | +5 | 484,497 |
Total Working Age Population:
Total Households:
Total Working Age Population:
Total Households:
Total Working Age Population:
Total Households: