Specialty Real Estate
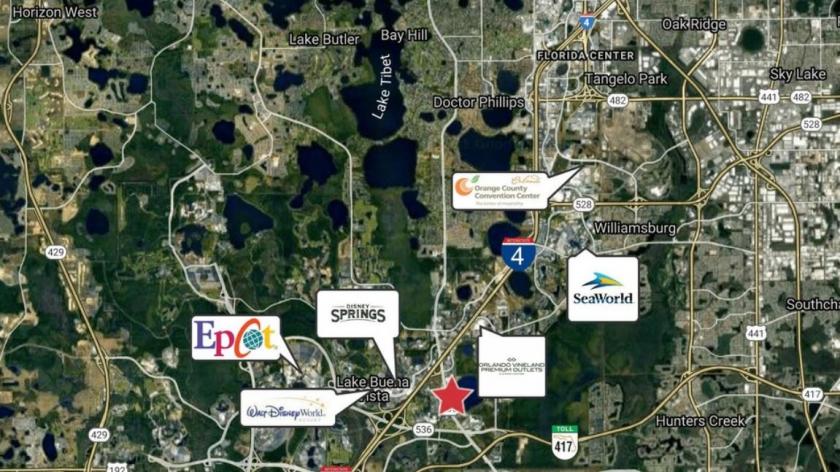
South Apopka Vineland Rd Orlando, FL 32821
South Apopka Vineland Rd Orlando, FL 32821
Details & Description
Property Highlights
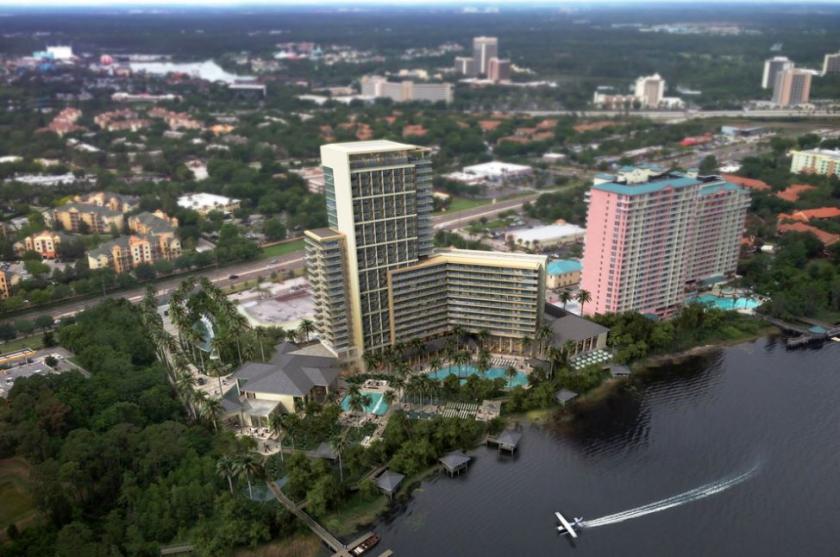
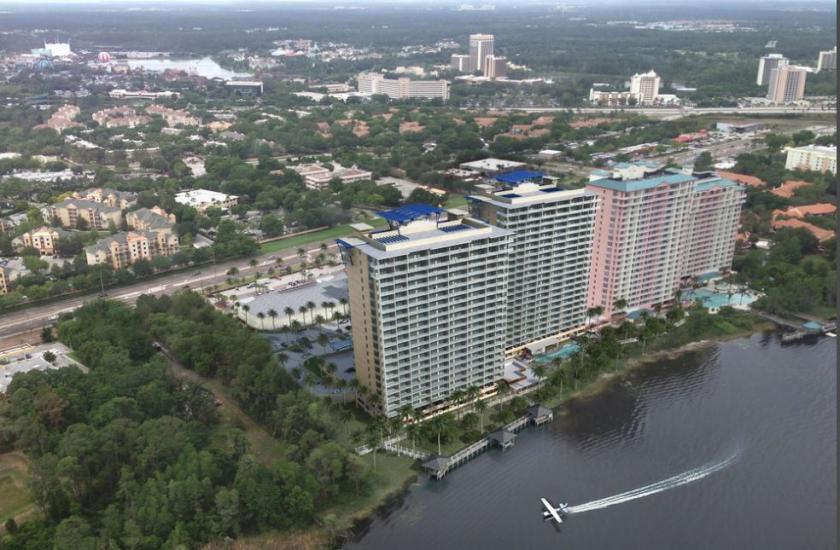
- • Lakefront HotelTimeshareMultifamily site
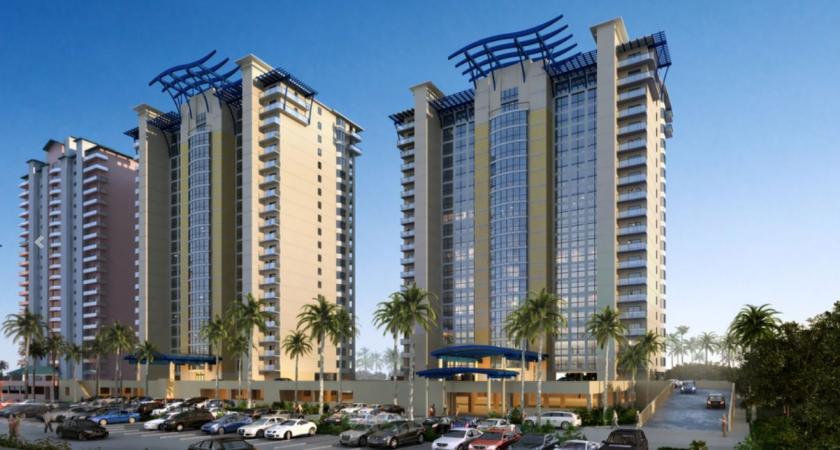
- • Fully approved for 280 units
- • Beautiful Lake Bryan Frontage
- • Full architectural and engineering plans completed
- • Easements for 2 signs on Apopka VinelandSR-535
- • Vision 2050 - Multifamily Permitted
Additional Photos
Listing Agents

Matthew Cichocki
O: 407-949-0738
M: 407-310-7954
mcichocki@realvest.com
O: 407-949-0738
M: 407-310-7954
mcichocki@realvest.com

Kevin O'Connor
O: 407-949-0736
M: 407-421-5063
koconnor@realvest.com
O: 407-949-0736
M: 407-421-5063
koconnor@realvest.com
While we strive to provide the most accurate information, all listing information, and demographic data, is provided by third-parties. As such, MyEListing will not be responsible for the accuracy of the information. It is strongly recommended that you verify all information with the listing agent, and any relevant agencies, prior to making any decisions.


