Retail Space
1810 Columbia Avenue Lancaster, PA 17603
1810 Columbia Avenue Lancaster, PA 17603
Details & Description
Property Highlights
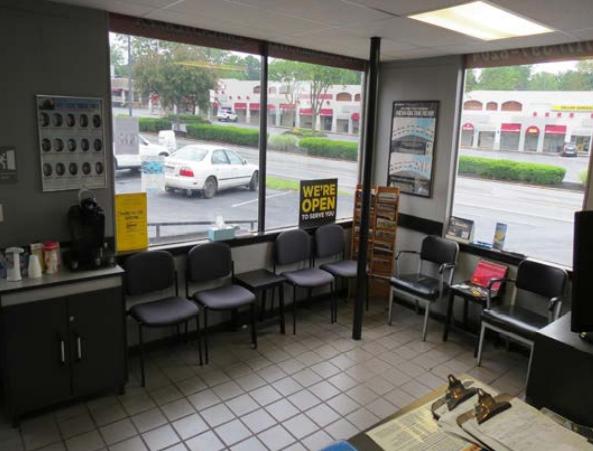
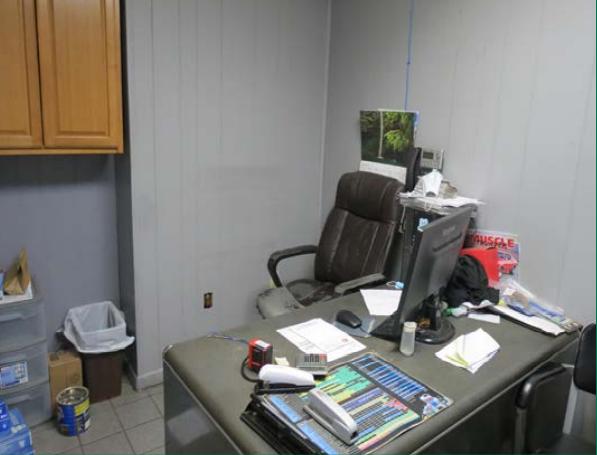
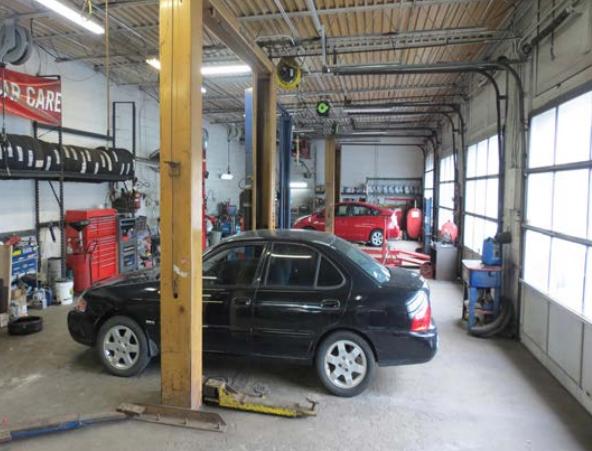
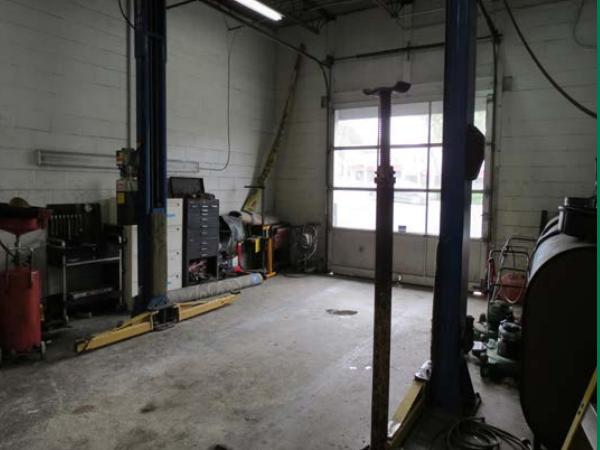
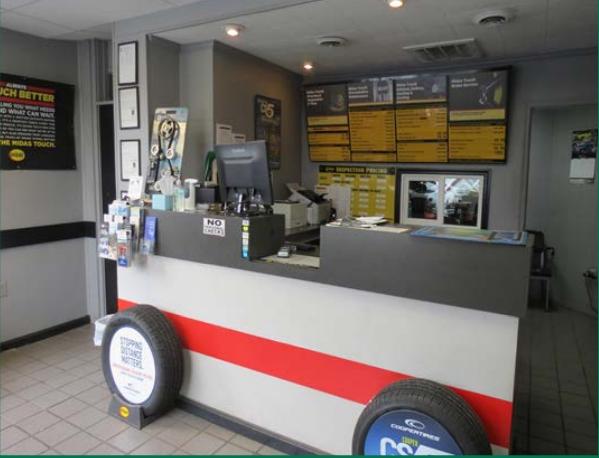
• Includes a check-inwaiting area, six 6 drive-in bays, lifts, air compressor.
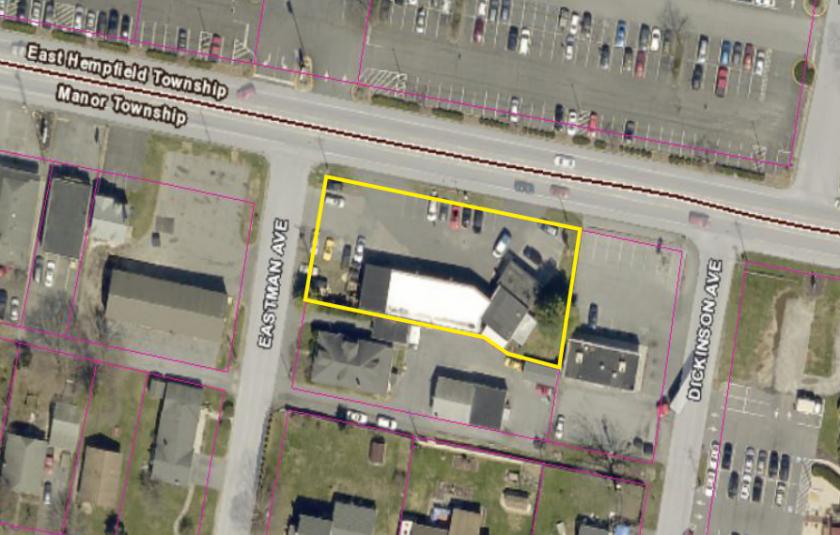
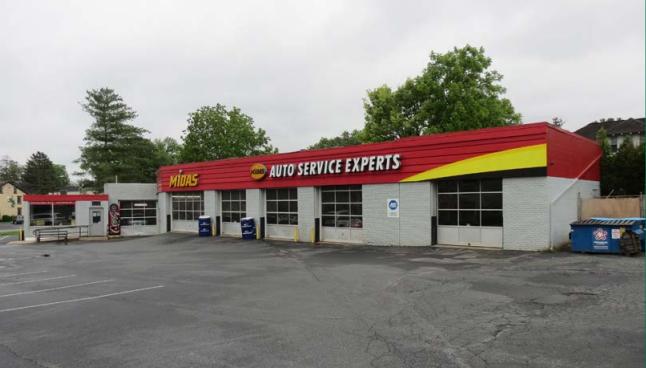
• Freestanding automotive serviceretail building in high profile location.
Additional Photos

Listing Agents

Dan Berger
O: 717-735-6000
dan@uscommercialrealty.net
O: 717-735-6000
dan@uscommercialrealty.net
While we strive to provide the most accurate information, all listing information, and demographic data, is provided by third-parties. As such, MyEListing will not be responsible for the accuracy of the information. It is strongly recommended that you verify all information with the listing agent, and any relevant agencies, prior to making any decisions.