Health Care and Medical Properties
340 East Yosemite Avenue Merced, CA 95340
340 East Yosemite Avenue Merced, CA 95340

Details & Description
Property Highlights
- • 2010 Finish-to-Suit Construction
- • No Termination Options
- • Rare Annual Increases of 2.5
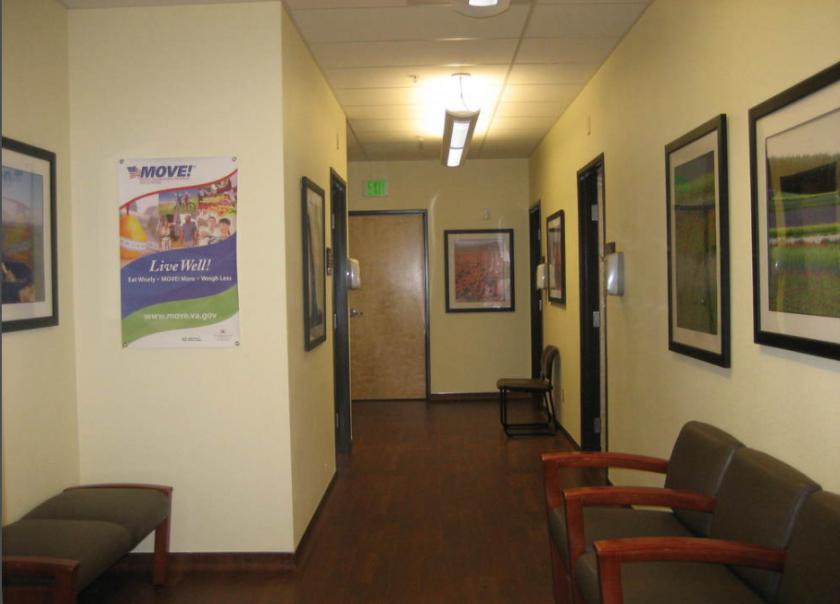
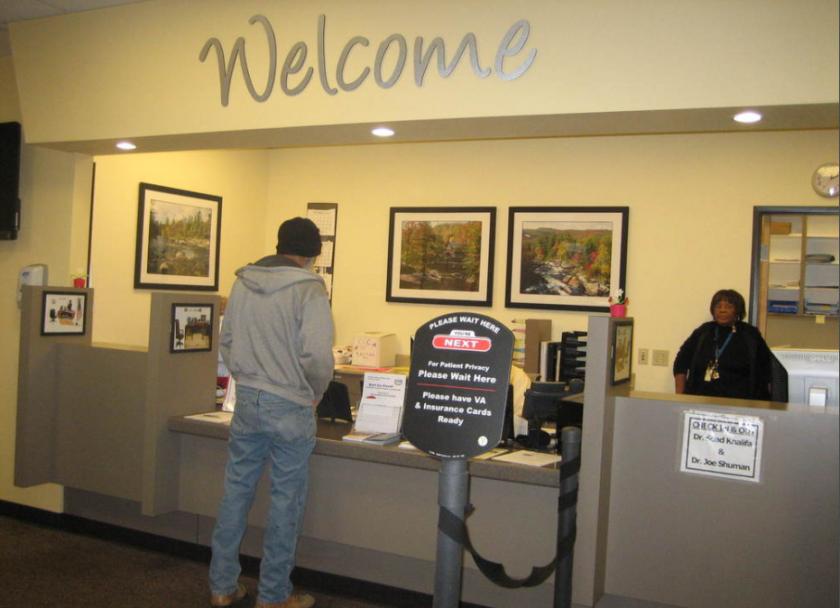
Additional Photos


Listing Agents

Chris Jackson
O: 818-933-2368
M: 818-802-2627
cjackson@naicapital.com
O: 818-933-2368
M: 818-802-2627
cjackson@naicapital.com

Todd Lorber
O: 818-933-2376
tlorber@naicapital.com
O: 818-933-2376
tlorber@naicapital.com
While we strive to provide the most accurate information, all listing information, and demographic data, is provided by third-parties. As such, MyEListing will not be responsible for the accuracy of the information. It is strongly recommended that you verify all information with the listing agent, and any relevant agencies, prior to making any decisions.


