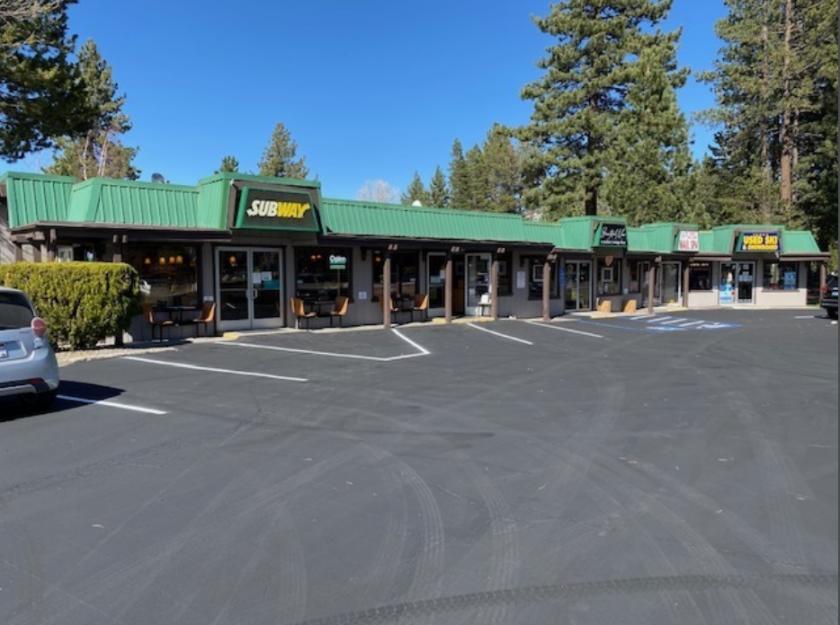
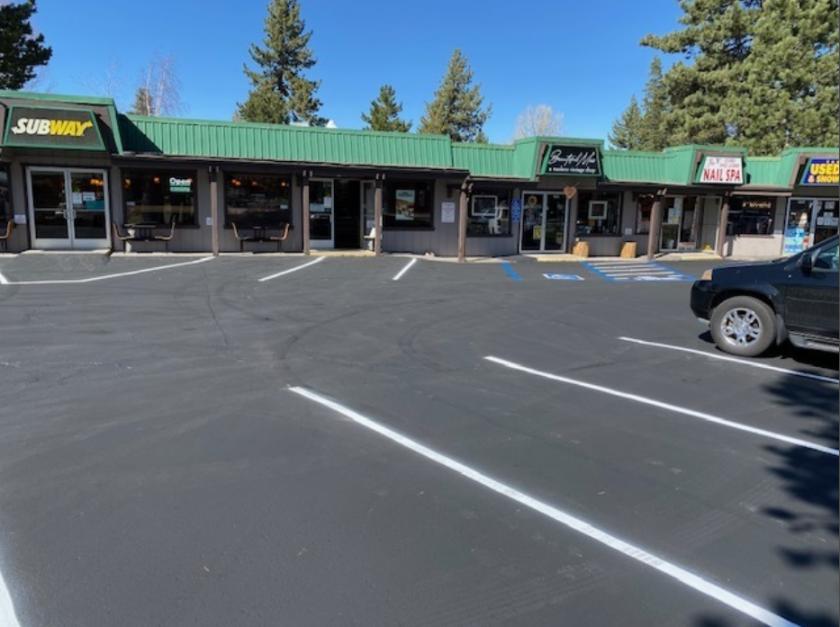
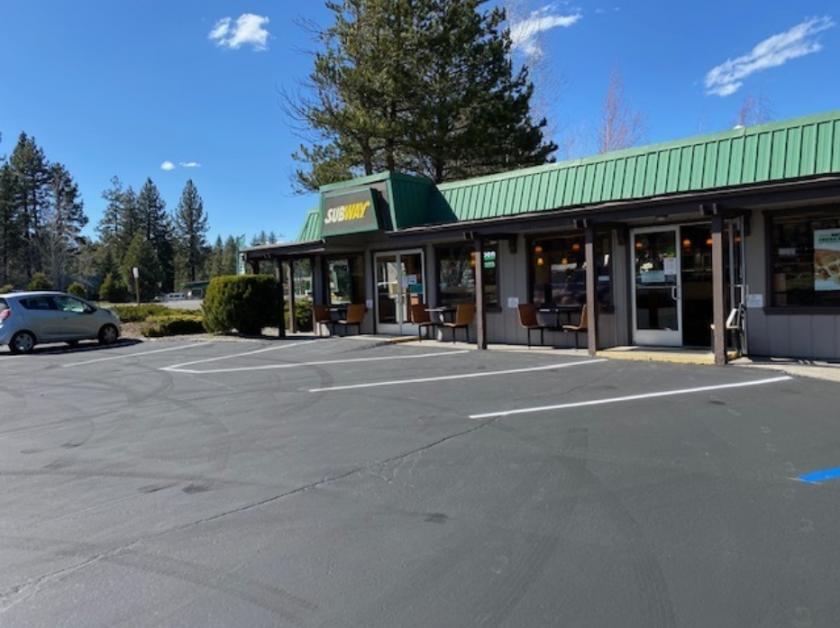
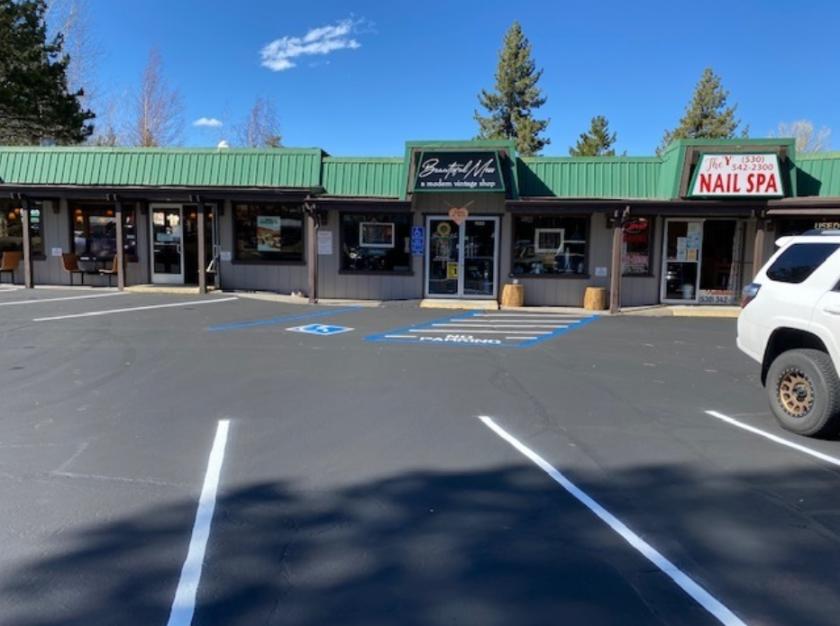
Retail Space
1023 Emerald Bay Road South Lake Tahoe, CA 96150
1023 Emerald Bay Road South Lake Tahoe, CA 96150
Details & Description
Property Highlights
• Resent price adjustment of $150,000.
• Resent price adjustment of $150,000.
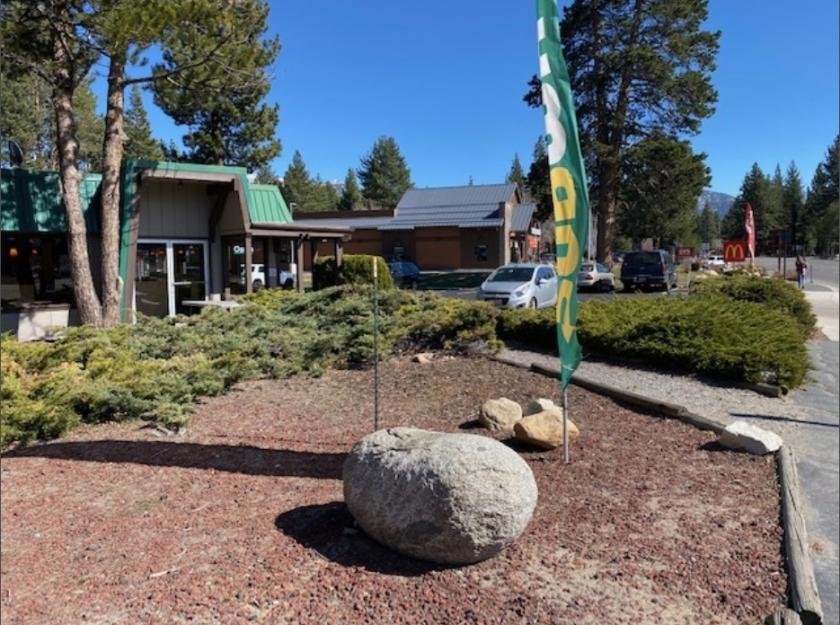
Additional Photos
Listing Agents

Scott Fair
O: 530-573-4669
M: 530-525-2304
sfair@naitahoesierra.com
O: 530-573-4669
M: 530-525-2304
sfair@naitahoesierra.com
While we strive to provide the most accurate information, all listing information, and demographic data, is provided by third-parties. As such, MyEListing will not be responsible for the accuracy of the information. It is strongly recommended that you verify all information with the listing agent, and any relevant agencies, prior to making any decisions.


