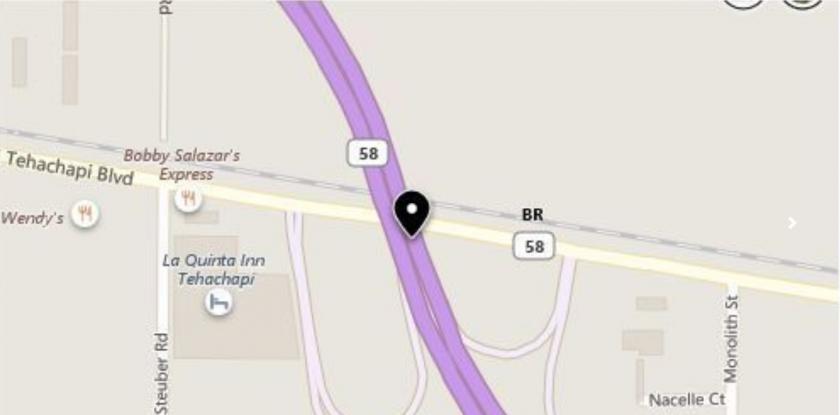
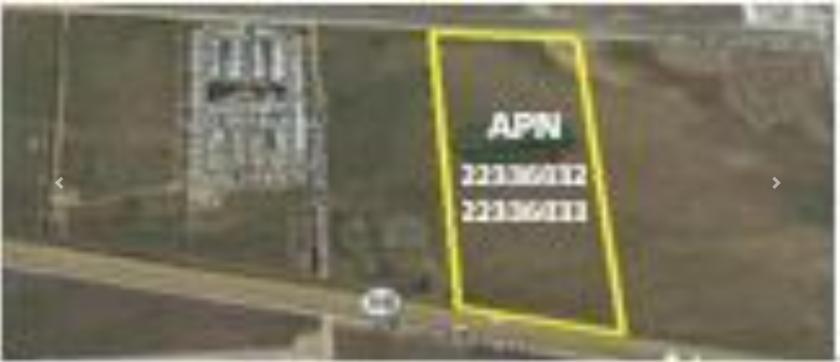
1-Mile | 3-Miles | 5-Miles | ||
---|---|---|---|---|
Total Population | 3,340 | 14,650 | 17,657 | |
Population Median Age | 37 | 36 | 37 | |
Population by Age | 0-9 Yrs | 536 (16%) | 2453 (16%) | 2890 (16%) |
10-19 Yrs | 471 (14%) | 2265 (15%) | 2612 (14%) | |
20-29 Yrs | 209 (6%) | 1276 (8%) | 1550 (8%) | |
30-39 Yrs | 784 (23%) | 2328 (15%) | 2681 (15%) | |
40-49 Yrs | 231 (6%) | 1745 (11%) | 2073 (11%) | |
50-59 Yrs | 395 (11%) | 1751 (11%) | 2232 (12%) | |
60-69 Yrs | 311 (9%) | 1542 (10%) | 1921 (10%) | |
70+ Yrs | 402 (12%) | 1290 (8%) | 1698 (9%) | |
Median HH Income | $42,858 | $57,842 | $62,322 | |
Total Household Income | < 24K | 388 (28%) | 1051 (19%) | 1161 (17%) |
25-49K | 369 (27%) | 1185 (22%) | 1317 (20%) | |
50-74K | 238 (17%) | 1278 (23%) | 1550 (23%) | |
75-99K | 96 (7%) | 456 (8%) | 639 (9%) | |
100-199K | 230 (16%) | 1199 (22%) | 1590 (24%) | |
200K+ | 38 (2%) | 210 (3%) | 274 (4%) | |
Highest Education Level | No Diploma | 304 | 1177 | 1251 |
Diploma or GED | 714 | 2596 | 3094 | |
Some College | 719 | 2826 | 3435 | |
Assoc. Degree | 121 | 1042 | 1385 | |
Bachelors Degree | 181 | 1033 | 1425 | |
Higher Degree | 172 | 639 | 795 | |
Total Housing Units | 1,553 | 5,934 | 7,200 | |
--Owner-Occupied | 725 | 3,337 | 4,195 | |
--Renter-Occupied | 633 | 2,042 | 2,336 | |
Owner-Occupied Values | < 100K | 95 | 292 | 303 |
100-199K | 208 | 997 | 1117 | |
200-299K | 336 | 1441 | 1731 | |
300-399K | 59 | 498 | 751 | |
400-499K | 0 | 15 | 107 | |
500K+ | 27 | 94 | 186 | |
Total Working Age Population | 2,539 | 11,059 | 13,367 | |
In Work Force | 1,429 | 6,370 | 7,656 | |
Not In Work Force | 1,110 | 4,690 | 5,711 | |
Workforce Employed | 1,324 | 5,946 | 7,197 | |
Workforce Unemployed | 105 | 423 | 459 | |
Civlian Workforce | 1,429 | 6,370 | 7,656 | |
Military Workforce | 0 | 0 | 0 | |
Total Households | 1,359 | 5,379 | 6,531 | |
Family Households | 825 | 3,628 | 4,457 | |
Non-Family Households | 533 | 1,751 | 2,075 | |
Married Couple | 555 | 2,492 | 3,213 | |
Other Family | 270 | 1,136 | 1,244 | |
Married w/Child | 322 | 1,284 | 1,524 | |
Single Male w/Child | 15 | 116 | 161 | |
Single Female w/Child | 125 | 351 | 352 |
Population Change Last Two Decades - Plus Projection
2000 | % | 2010 | % | 2020 | % | 2030 | |
---|---|---|---|---|---|---|---|
California | 33,871,648 | +10 | 37,253,956 | +9 | 40,467,295 | +8 | 43,631,295 |
Kern County | 661,645 | +27 | 839,631 | +11 | 928,308 | +14 | 1,062,325 |
Total Working Age Population:
Total Households:
Total Working Age Population:
Total Households:
Total Working Age Population:
Total Households: