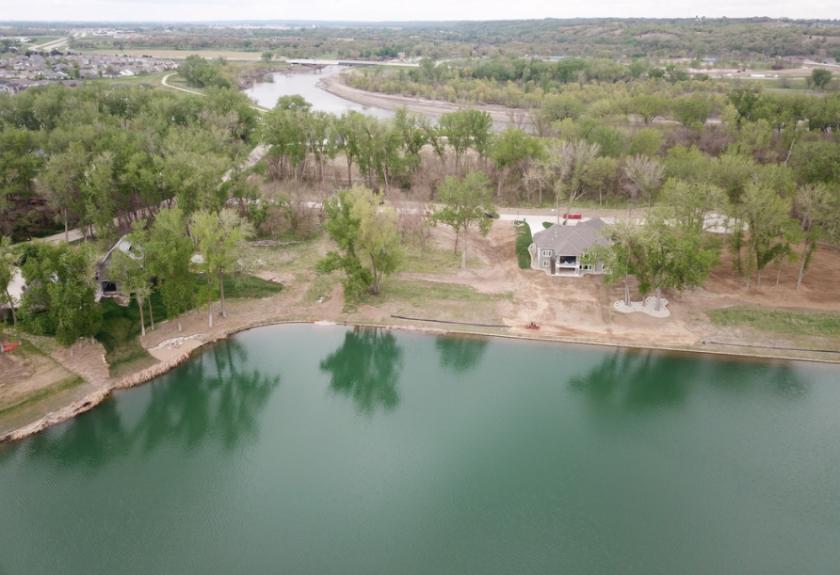
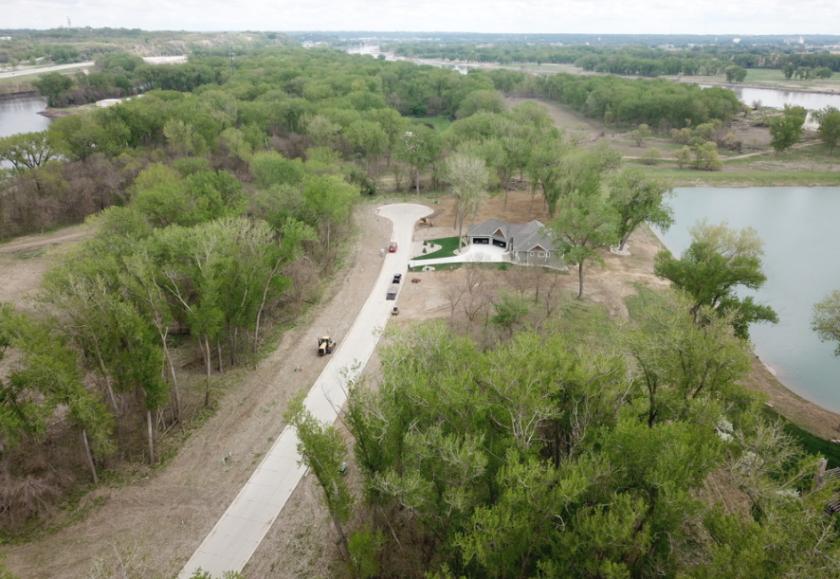
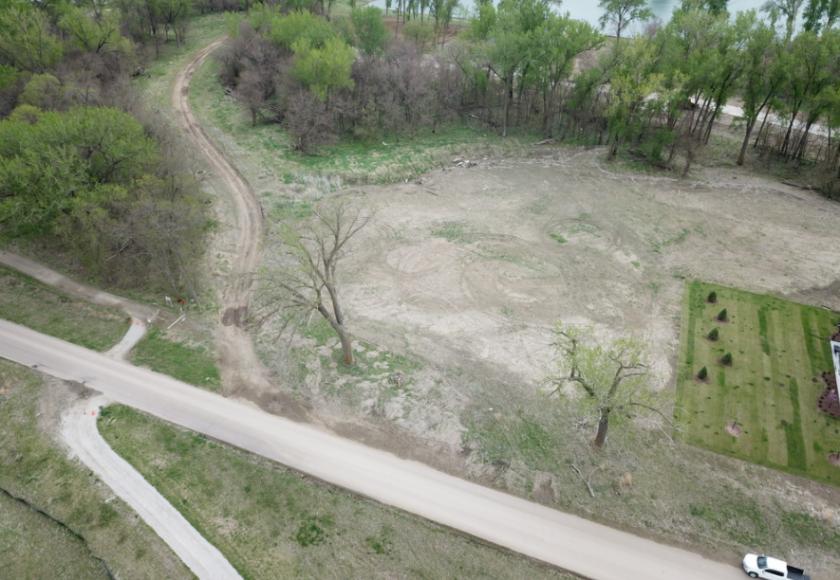
1-Mile | 3-Miles | 5-Miles | ||
---|---|---|---|---|
Total Population | 1,441 | 13,095 | 50,244 | |
Population Median Age | 39 | 38 | 36 | |
Population by Age | 0-9 Yrs | 164 (11%) | 1893 (14%) | 7549 (15%) |
10-19 Yrs | 201 (13%) | 1903 (14%) | 7854 (15%) | |
20-29 Yrs | 175 (12%) | 1581 (12%) | 7006 (13%) | |
30-39 Yrs | 159 (11%) | 1591 (12%) | 6544 (13%) | |
40-49 Yrs | 202 (14%) | 1612 (12%) | 6116 (12%) | |
50-59 Yrs | 194 (13%) | 1754 (13%) | 6171 (12%) | |
60-69 Yrs | 232 (16%) | 1623 (12%) | 5083 (10%) | |
70+ Yrs | 114 (7%) | 1139 (8%) | 3921 (7%) | |
Median HH Income | $98,019 | $62,820 | $54,432 | |
Total Household Income | < 24K | 70 (11%) | 1089 (21%) | 4523 (24%) |
25-49K | 91 (14%) | 963 (18%) | 4084 (21%) | |
50-74K | 78 (12%) | 859 (16%) | 3532 (18%) | |
75-99K | 76 (12%) | 817 (16%) | 2503 (13%) | |
100-199K | 179 (28%) | 985 (19%) | 3203 (17%) | |
200K+ | 124 (20%) | 363 (7%) | 848 (4%) | |
Highest Education Level | No Diploma | 30 | 1286 | 6586 |
Diploma or GED | 214 | 2968 | 10429 | |
Some College | 233 | 1641 | 6088 | |
Assoc. Degree | 81 | 818 | 2489 | |
Bachelors Degree | 257 | 1210 | 3617 | |
Higher Degree | 179 | 617 | 1946 | |
Total Housing Units | 657 | 5,496 | 20,220 | |
--Owner-Occupied | 402 | 3,346 | 10,963 | |
--Renter-Occupied | 217 | 1,729 | 7,729 | |
Owner-Occupied Values | < 100K | 27 | 1250 | 4670 |
100-199K | 62 | 1002 | 4009 | |
200-299K | 113 | 532 | 1202 | |
300-399K | 117 | 327 | 623 | |
400-499K | 43 | 121 | 238 | |
500K+ | 40 | 113 | 222 | |
Total Working Age Population | 1,156 | 9,930 | 37,450 | |
In Work Force | 756 | 6,693 | 25,519 | |
Not In Work Force | 400 | 3,237 | 11,931 | |
Workforce Employed | 751 | 6,467 | 24,143 | |
Workforce Unemployed | 5 | 225 | 1,366 | |
Civlian Workforce | 756 | 6,692 | 25,509 | |
Military Workforce | 0 | 1 | 10 | |
Total Households | 619 | 5,075 | 18,692 | |
Family Households | 396 | 3,341 | 12,171 | |
Non-Family Households | 222 | 1,734 | 6,522 | |
Married Couple | 345 | 2,239 | 7,742 | |
Other Family | 51 | 1,101 | 4,429 | |
Married w/Child | 113 | 819 | 3,567 | |
Single Male w/Child | 37 | 209 | 842 | |
Single Female w/Child | 12 | 537 | 1,869 |
Population Change Last Two Decades - Plus Projection
2000 | % | 2010 | % | 2020 | % | 2030 | |
---|---|---|---|---|---|---|---|
Iowa | 2,926,324 | +4 | 3,046,355 | -100 | |||
Plymouth County | 24,849 | +1 | 24,986 | -100 | |||
Woodbury County | 103,877 | -2 | 102,172 | -100 | |||
Nebraska | 1,711,263 | +7 | 1,826,341 | +6 | 1,943,452 | +6 | 2,053,788 |
Dakota County | 20,253 | +4 | 21,006 | +5 | 21,975 | +3 | 22,639 |
South Dakota | 754,844 | +8 | 814,180 | +9 | 889,447 | +7 | 951,885 |
Union County | 12,584 | +14 | 14,399 | +16 | 16,659 | +14 | 18,929 |
Total Working Age Population:
Total Households:
Total Working Age Population:
Total Households:
Total Working Age Population:
Total Households: