Office Space
2423 West Dunlap Avenue Phoenix, AZ 85021
2423 West Dunlap Avenue Phoenix, AZ 85021
Details & Description
Property Highlights
- • Monument signage available
- • On future light rail line
- • Easy access to I-17
- • Shared waiting room and reception
- • On-site ownership
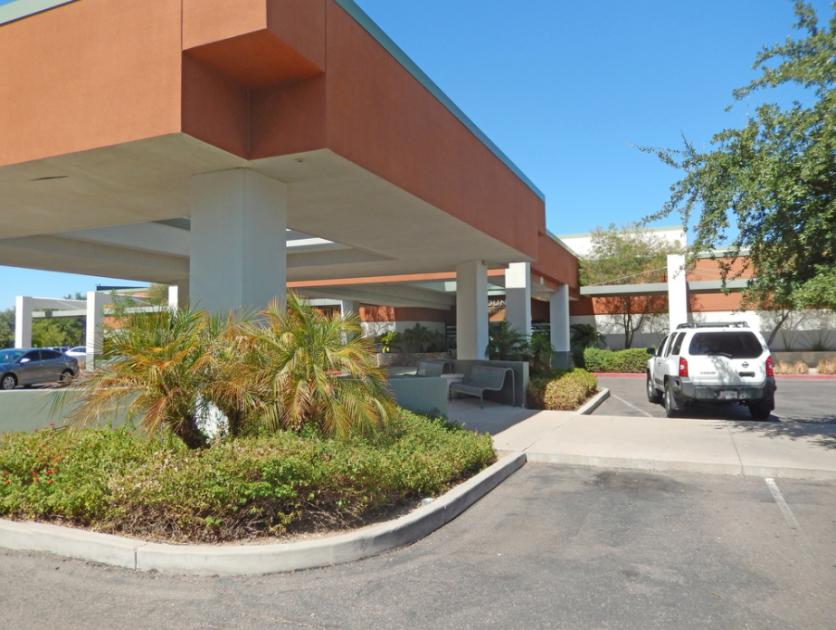
- • High visibility on Dunlap Ave
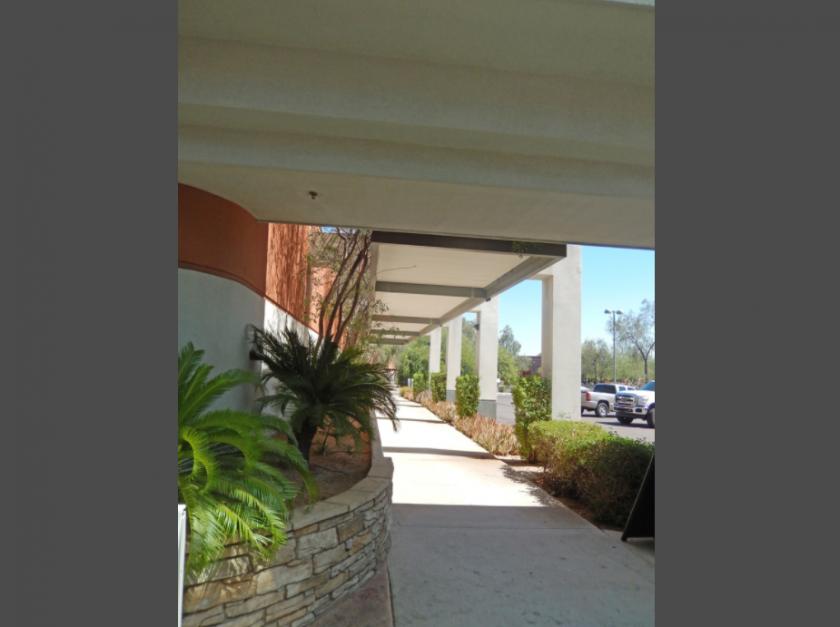
Additional Photos


Listing Agents

Tom Bean
O: 602-393-6790
M: 480-273-1590
thomas.bean@naihorizon.com
O: 602-393-6790
M: 480-273-1590
thomas.bean@naihorizon.com
While we strive to provide the most accurate information, all listing information, and demographic data, is provided by third-parties. As such, MyEListing will not be responsible for the accuracy of the information. It is strongly recommended that you verify all information with the listing agent, and any relevant agencies, prior to making any decisions.


