Commercial Land
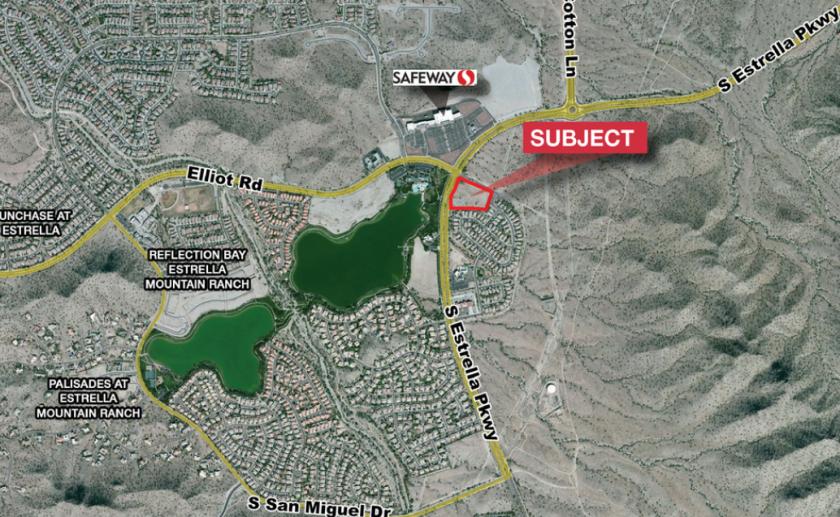
10047 Estrella Pkwy Goodyear, AZ 85338
10047 Estrella Pkwy Goodyear, AZ 85338
Details & Description
Property Highlights
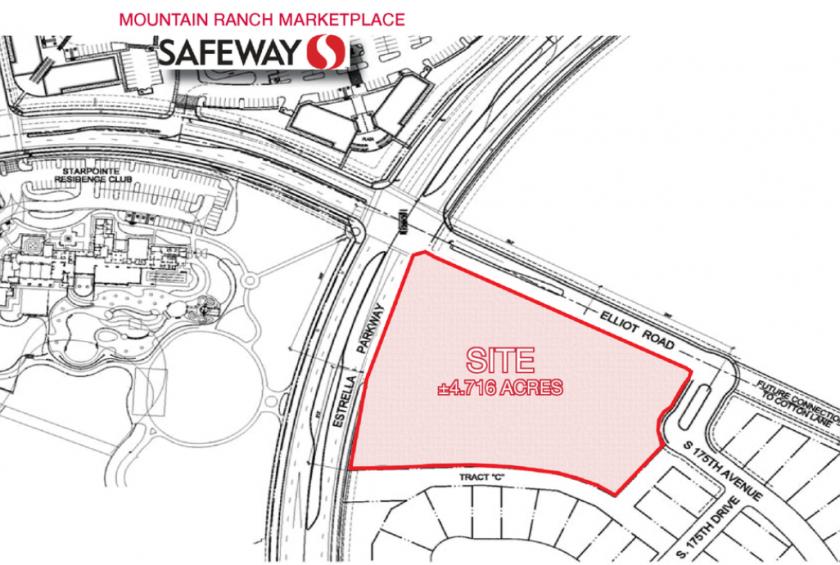
• Zoning PAD planned area development, City of Goodyear. Current zoning will allow multiple commercial and retail uses
• Restrictions to use prohibit retail shop space development in the internal portions of the property
Listing Agents

Lane Neville
O: 602-393-6726
M: 602-463-9105
lane.neville@naihorizon.com
O: 602-393-6726
M: 602-463-9105
lane.neville@naihorizon.com

Logan Crum
NAI Horizon
O: 602-852-3417
M: 509-590-6917
logan.crum@naihorizon.com
NAI Horizon
O: 602-852-3417
M: 509-590-6917
logan.crum@naihorizon.com
While we strive to provide the most accurate information, all listing information, and demographic data, is provided by third-parties. As such, MyEListing will not be responsible for the accuracy of the information. It is strongly recommended that you verify all information with the listing agent, and any relevant agencies, prior to making any decisions.