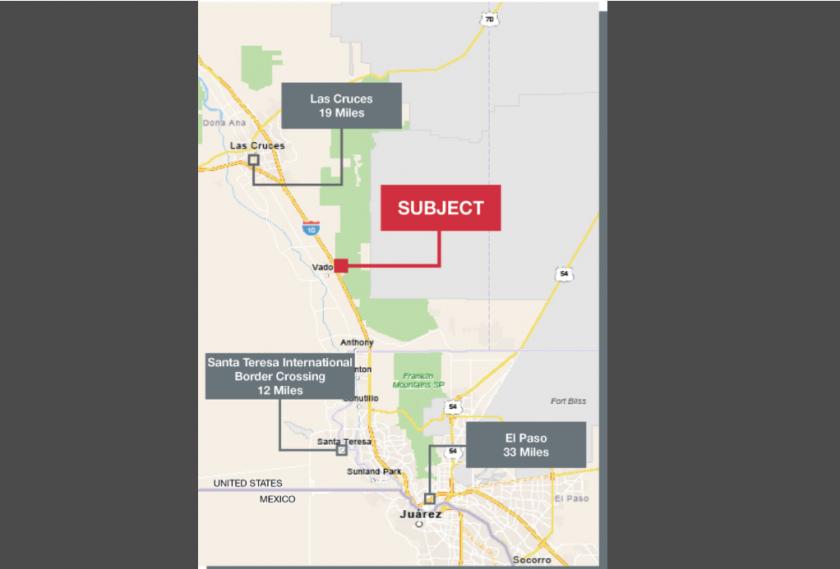
1-Mile | 3-Miles | 5-Miles | ||
---|---|---|---|---|
Total Population | 1,577 | 4,166 | 8,036 | |
Population Median Age | 30 | 34 | 36 | |
Population by Age | 0-9 Yrs | 267 (16%) | 697 (16%) | 1262 (15%) |
10-19 Yrs | 388 (24%) | 752 (18%) | 1423 (17%) | |
20-29 Yrs | 189 (11%) | 553 (13%) | 896 (11%) | |
30-39 Yrs | 175 (11%) | 416 (9%) | 968 (12%) | |
40-49 Yrs | 246 (15%) | 554 (13%) | 923 (11%) | |
50-59 Yrs | 196 (12%) | 481 (11%) | 885 (11%) | |
60-69 Yrs | 112 (7%) | 467 (11%) | 907 (11%) | |
70+ Yrs | 5 (0%) | 246 (5%) | 772 (9%) | |
Median HH Income | $32,872 | $33,148 | $33,471 | |
Total Household Income | < 24K | 149 (39%) | 448 (36%) | 931 (36%) |
25-49K | 158 (42%) | 511 (42%) | 956 (37%) | |
50-74K | 9 (2%) | 79 (6%) | 192 (7%) | |
75-99K | 55 (14%) | 90 (7%) | 191 (7%) | |
100-199K | 1 (0%) | 82 (6%) | 236 (9%) | |
200K+ | 0 (0%) | 2 (0%) | 15 (0%) | |
Highest Education Level | No Diploma | 453 | 1204 | 2236 |
Diploma or GED | 157 | 578 | 1094 | |
Some College | 152 | 393 | 820 | |
Assoc. Degree | 1 | 62 | 199 | |
Bachelors Degree | 27 | 135 | 291 | |
Higher Degree | 10 | 44 | 180 | |
Total Housing Units | 406 | 1,367 | 2,916 | |
--Owner-Occupied | 246 | 891 | 1,953 | |
--Renter-Occupied | 127 | 320 | 570 | |
Owner-Occupied Values | < 100K | 48 | 410 | 972 |
100-199K | 172 | 355 | 588 | |
200-299K | 25 | 81 | 237 | |
300-399K | 0 | 14 | 78 | |
400-499K | 0 | 30 | 73 | |
500K+ | 0 | 0 | 6 | |
Total Working Age Population | 1,039 | 2,962 | 5,866 | |
In Work Force | 496 | 1,454 | 3,045 | |
Not In Work Force | 543 | 1,508 | 2,821 | |
Workforce Employed | 418 | 1,279 | 2,770 | |
Workforce Unemployed | 78 | 175 | 272 | |
Civlian Workforce | 496 | 1,454 | 3,042 | |
Military Workforce | 0 | 0 | 3 | |
Total Households | 373 | 1,211 | 2,523 | |
Family Households | 335 | 997 | 2,096 | |
Non-Family Households | 39 | 215 | 426 | |
Married Couple | 199 | 737 | 1,482 | |
Other Family | 135 | 259 | 615 | |
Married w/Child | 86 | 292 | 582 | |
Single Male w/Child | 0 | 21 | 98 | |
Single Female w/Child | 91 | 156 | 323 |
Population Change Last Two Decades - Plus Projection
2000 | % | 2010 | % | 2020 | % | 2030 | |
---|---|---|---|---|---|---|---|
New Mexico | 1,819,046 | +13 | 2,059,179 | +6 | 2,187,183 | +6 | 2,308,475 |
Doña Ana County | 174,682 | +20 | 209,233 | +11 | 232,946 | +9 | 255,070 |
Total Working Age Population:
Total Households:
Total Working Age Population:
Total Households:
Total Working Age Population:
Total Households: