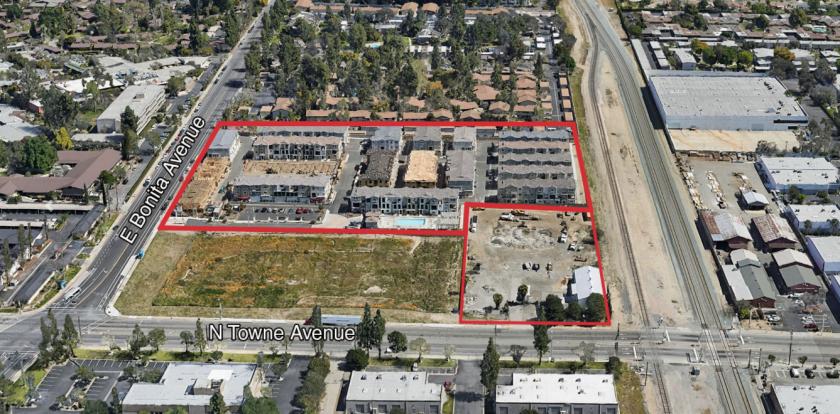
1-Mile | 3-Miles | 5-Miles | ||
---|---|---|---|---|
Total Population | 24,389 | 163,192 | 371,726 | |
Population Median Age | 38 | 37 | 37 | |
Population by Age | 0-9 Yrs | 3126 (12%) | 20709 (12%) | 47085 (12%) |
10-19 Yrs | 3211 (13%) | 24335 (14%) | 54547 (14%) | |
20-29 Yrs | 3386 (13%) | 26265 (16%) | 59777 (16%) | |
30-39 Yrs | 3503 (14%) | 21161 (12%) | 48314 (12%) | |
40-49 Yrs | 3584 (14%) | 20646 (12%) | 46054 (12%) | |
50-59 Yrs | 2816 (11%) | 19342 (11%) | 46743 (12%) | |
60-69 Yrs | 2185 (8%) | 16138 (9%) | 37104 (9%) | |
70+ Yrs | 2578 (10%) | 14595 (8%) | 32102 (8%) | |
Median HH Income | $80,921 | $69,090 | $69,143 | |
Total Household Income | < 24K | 1041 (14%) | 8228 (16%) | 17457 (15%) |
25-49K | 1120 (15%) | 9541 (19%) | 21729 (19%) | |
50-74K | 1140 (15%) | 8407 (17%) | 20237 (18%) | |
75-99K | 1303 (18%) | 6884 (14%) | 15120 (13%) | |
100-199K | 2022 (28%) | 11973 (24%) | 27398 (24%) | |
200K+ | 594 (8%) | 3538 (7%) | 7786 (7%) | |
Highest Education Level | No Diploma | 3086 | 21567 | 51074 |
Diploma or GED | 3162 | 21676 | 52008 | |
Some College | 3780 | 23735 | 55343 | |
Assoc. Degree | 1372 | 7566 | 19000 | |
Bachelors Degree | 2848 | 17120 | 38763 | |
Higher Degree | 2265 | 12334 | 23220 | |
Total Housing Units | 7,571 | 50,870 | 114,424 | |
--Owner-Occupied | 3,936 | 26,268 | 61,759 | |
--Renter-Occupied | 3,284 | 22,303 | 47,968 | |
Owner-Occupied Values | < 100K | 154 | 2054 | 3846 |
100-199K | 61 | 900 | 1958 | |
200-299K | 226 | 1969 | 5190 | |
300-399K | 957 | 5557 | 12664 | |
400-499K | 1000 | 5233 | 13325 | |
500K+ | 1538 | 10553 | 24775 | |
Total Working Age Population | 19,198 | 129,321 | 294,056 | |
In Work Force | 12,482 | 81,794 | 187,450 | |
Not In Work Force | 6,717 | 47,527 | 106,606 | |
Workforce Employed | 11,501 | 76,174 | 175,332 | |
Workforce Unemployed | 967 | 5,538 | 11,923 | |
Civlian Workforce | 12,469 | 81,711 | 187,256 | |
Military Workforce | 13 | 83 | 194 | |
Total Households | 7,220 | 48,570 | 109,727 | |
Family Households | 5,079 | 34,927 | 81,381 | |
Non-Family Households | 2,141 | 13,644 | 28,346 | |
Married Couple | 3,652 | 23,099 | 55,073 | |
Other Family | 1,427 | 11,828 | 26,308 | |
Married w/Child | 1,573 | 9,507 | 23,633 | |
Single Male w/Child | 99 | 1,668 | 3,609 | |
Single Female w/Child | 412 | 3,589 | 7,567 |
Population Change Last Two Decades - Plus Projection
2000 | % | 2010 | % | 2020 | % | 2030 | |
---|---|---|---|---|---|---|---|
California | 33,871,648 | +10 | 37,253,956 | +9 | 40,467,295 | +8 | 43,631,295 |
Los Angeles County | 9,519,338 | +3 | 9,818,605 | +6 | 10,369,367 | +4 | 10,759,850 |
Riverside County | 1,545,387 | +42 | 2,189,641 | +14 | 2,493,116 | +14 | 2,843,493 |
San Bernardino County | 1,709,434 | +19 | 2,035,210 | +9 | 2,223,189 | +11 | 2,468,202 |
Total Working Age Population:
Total Households:
Total Working Age Population:
Total Households:
Total Working Age Population:
Total Households: