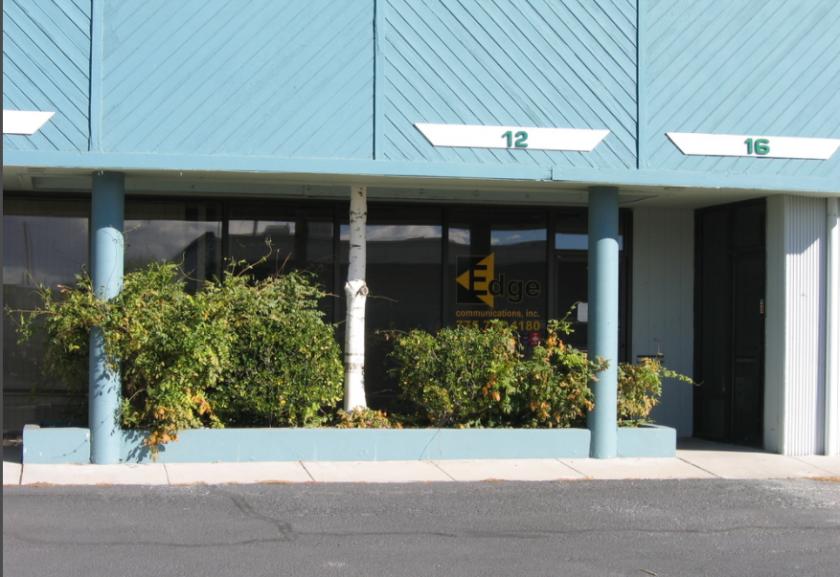
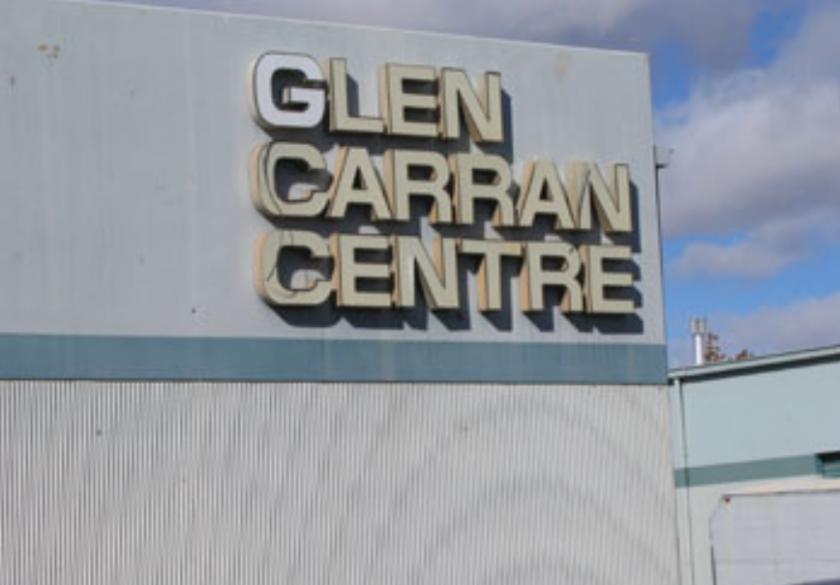
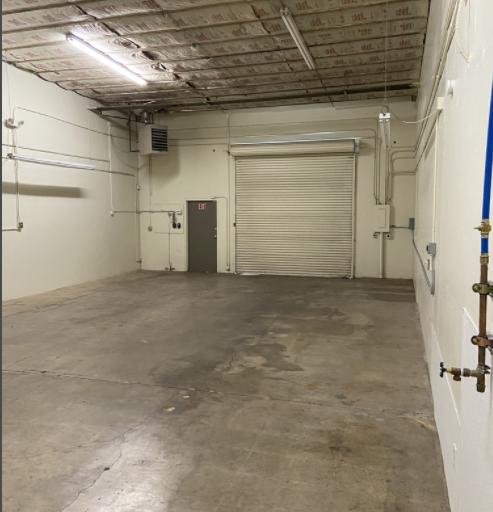
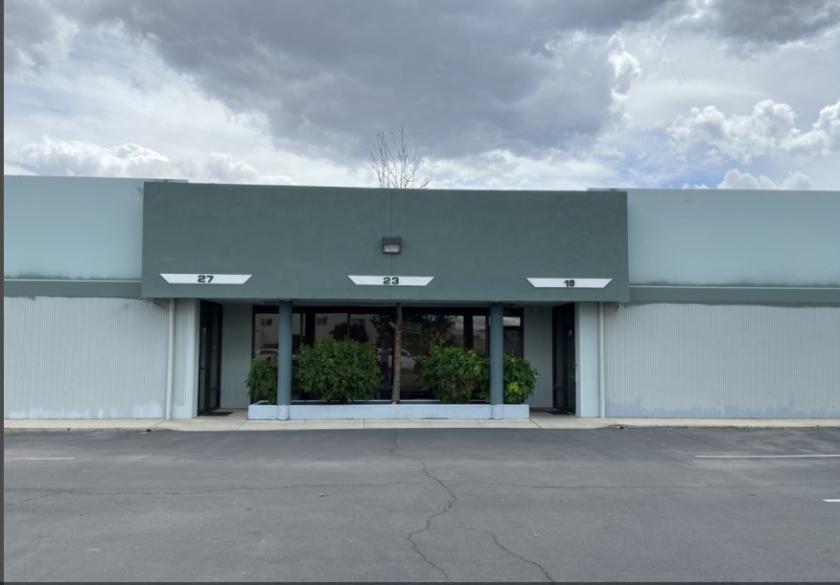
1-Mile | 3-Miles | 5-Miles | ||
---|---|---|---|---|
Total Population | 5,509 | 81,387 | 205,159 | |
Population Median Age | 38 | 39 | 38 | |
Population by Age | 0-9 Yrs | 595 (10%) | 9908 (12%) | 25218 (12%) |
10-19 Yrs | 759 (13%) | 10034 (12%) | 25131 (12%) | |
20-29 Yrs | 1016 (18%) | 12947 (15%) | 35473 (17%) | |
30-39 Yrs | 616 (11%) | 10807 (13%) | 27713 (13%) | |
40-49 Yrs | 614 (11%) | 9449 (11%) | 23943 (11%) | |
50-59 Yrs | 836 (15%) | 10599 (13%) | 25546 (12%) | |
60-69 Yrs | 466 (8%) | 9135 (11%) | 22500 (10%) | |
70+ Yrs | 608 (11%) | 8508 (10%) | 19634 (9%) | |
Median HH Income | $28,670 | $51,605 | $49,856 | |
Total Household Income | < 24K | 1155 (43%) | 7331 (22%) | 19431 (23%) |
25-49K | 689 (26%) | 8407 (25%) | 22764 (27%) | |
50-74K | 397 (15%) | 6603 (20%) | 16038 (19%) | |
75-99K | 214 (8%) | 4390 (13%) | 10366 (12%) | |
100-199K | 150 (5%) | 5087 (15%) | 12920 (15%) | |
200K+ | 23 (0%) | 621 (1%) | 2646 (3%) | |
Highest Education Level | No Diploma | 835 | 10289 | 22920 |
Diploma or GED | 1519 | 17419 | 37106 | |
Some College | 931 | 13603 | 35112 | |
Assoc. Degree | 184 | 4553 | 11330 | |
Bachelors Degree | 134 | 6409 | 20468 | |
Higher Degree | 85 | 2958 | 10340 | |
Total Housing Units | 2,985 | 34,542 | 90,033 | |
--Owner-Occupied | 545 | 15,496 | 35,923 | |
--Renter-Occupied | 2,082 | 16,944 | 48,241 | |
Owner-Occupied Values | < 100K | 186 | 1609 | 4133 |
100-199K | 129 | 3222 | 6310 | |
200-299K | 134 | 5946 | 10530 | |
300-399K | 24 | 3174 | 8556 | |
400-499K | 7 | 905 | 3663 | |
500K+ | 66 | 639 | 2731 | |
Total Working Age Population | 4,611 | 65,138 | 165,759 | |
In Work Force | 3,165 | 43,342 | 111,997 | |
Not In Work Force | 1,446 | 21,796 | 53,761 | |
Workforce Employed | 2,836 | 40,327 | 104,626 | |
Workforce Unemployed | 329 | 2,989 | 7,330 | |
Civlian Workforce | 3,165 | 43,316 | 111,956 | |
Military Workforce | 0 | 26 | 41 | |
Total Households | 2,628 | 32,440 | 84,164 | |
Family Households | 1,213 | 19,351 | 46,174 | |
Non-Family Households | 1,414 | 13,089 | 37,990 | |
Married Couple | 694 | 12,665 | 30,020 | |
Other Family | 520 | 6,685 | 16,154 | |
Married w/Child | 337 | 5,214 | 12,170 | |
Single Male w/Child | 13 | 950 | 2,493 | |
Single Female w/Child | 178 | 2,370 | 6,298 |
Population Change Last Two Decades - Plus Projection
2000 | % | 2010 | % | 2020 | % | 2030 | |
---|---|---|---|---|---|---|---|
Nevada | 1,998,257 | +35 | 2,700,551 | +17 | 3,149,234 | +10 | 3,460,728 |
Lyon County | 34,501 | +51 | 51,980 | +12 | 57,987 | +13 | 65,788 |
Storey County | 3,399 | +18 | 4,010 | +11 | 4,465 | +29 | 5,759 |
Washoe County | 339,486 | +24 | 421,407 | +14 | 479,336 | +13 | 542,877 |
Total Working Age Population:
Total Households:
Total Working Age Population:
Total Households:
Total Working Age Population:
Total Households: