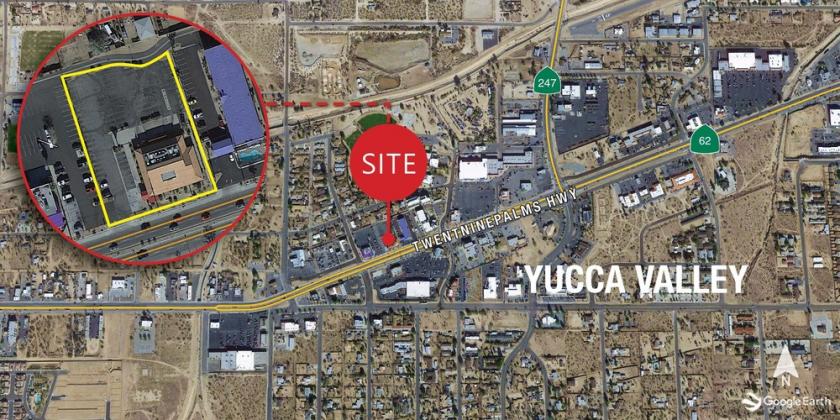
Freestanding Sizzler Restaurant, 7,602 square foot building on a 1.2 acre lot with 91 parking spaces.
Highlights
-Sizzler Restaurant-7,602 square feet for Lease or Sale
-Excellent Highway visibility
-Situated on main highway through town/en-route to Joshua Tree
-Restaurant has a large banquet room
-Traffic Counts-Twenty Nine Palms Hwy- 30,550 cars per day
-2.9 million annual visitor count to Joshua Tree National Park
-Building built in 1988 - 91 parking stalls
No part of this information may be copied, reproduced, repurposed, or screen-captured for any commercial purpose without prior written authorization from MyEListing.
While we strive to provide the most accurate information, all listing information, and demographic data, is provided by third-parties. As such, MyEListing will not be responsible for the accuracy of the information. It is strongly recommended that you verify all information with the listing agent, and any relevant agencies, prior to making any decisions.
What is the building size of this Retail property in Yucca Valley, CA?
The size of the building/unit at 57084 Twentynine Palms Highway in Yucca Valley is 7,602 square feet
How much land does the Yucca Valley, CA property at 57084 Twentynine Palms Highway include?
57084 Twentynine Palms Highway in Yucca Valley includes 1.200 acres of land
What kind of Retail is the propery at 57084 Twentynine Palms Highway?
The property at 57084 Twentynine Palms Highway Yucca Valley, CA 92284 is listed as a Food Service Retail property
What is the population within 1 mile of 57084 Twentynine Palms Highway in Yucca Valley?
The population within 1 mile of 57084 Twentynine Palms Highway Yucca Valley, CA 92284 is 4,272 people.
Who do I contact for questions about 57084 Twentynine Palms Highway?
You should contact the listing agent,
Maggie Gonzalez, for any details regarding this commercial listing.