Pleasant Valley Center is located at the southeast corner of South Pleasant
Valley Road and East Tevis Street in the heart of the Winchester regional
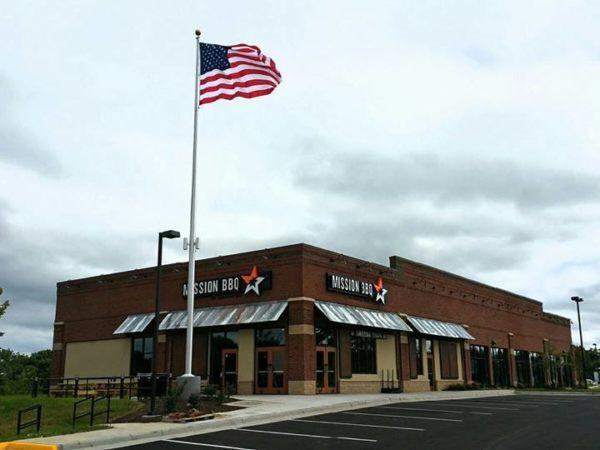
retail district. T.G.I. Fridays, Chuck E. Cheese’s, Mission BBQ, Massage Envy
and PIVOT Physical Therapy are open, with additional retail to be built. 2,200
square feet of retail space is available adjacent to Panera Bread, in Pleasant
Valley Shops. Proposed I-81 overpass has commenced construction with
an estimated completion by 2021, bringing additional traffic to the 21,000
AADT on South Pleasant Valley Road.
No part of this information may be copied, reproduced, repurposed, or screen-captured for any commercial purpose without prior written authorization from MyEListing.
While we strive to provide the most accurate information, all listing information, and demographic data, is provided by third-parties. As such, MyEListing will not be responsible for the accuracy of the information. It is strongly recommended that you verify all information with the listing agent, and any relevant agencies, prior to making any decisions.
What is the asking price for 2605 South Pleasant Valley Road in Winchester?
The asking price for 2605 South Pleasant Valley Road is $25.00 - $30.00 a SF per Year
What is the building size of this commercial Retail property?
The size of this multi-unit property varies between 2200 - 13000 square feet
What kind of Retail is the propery at 2605 South Pleasant Valley Road?
The property at 2605 South Pleasant Valley Road Winchester, VA 22601 is listed as a Shopping Center Retail property
What is the population within 1 mile of 2605 South Pleasant Valley Road in Winchester?
The population within 1 mile of 2605 South Pleasant Valley Road Winchester, VA 22601 is 5,714 people.
Who do I contact for questions about 2605 South Pleasant Valley Road?
You should contact the listing agent,
Andrew Segall, for any details regarding this commercial listing.