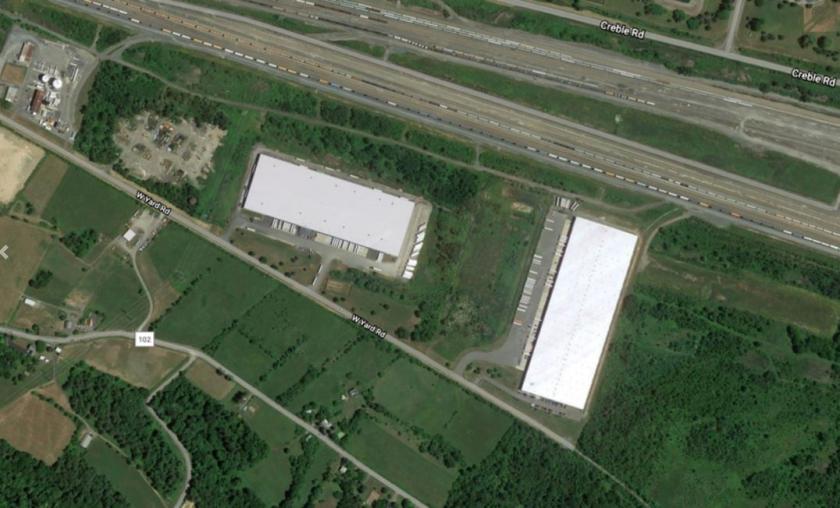
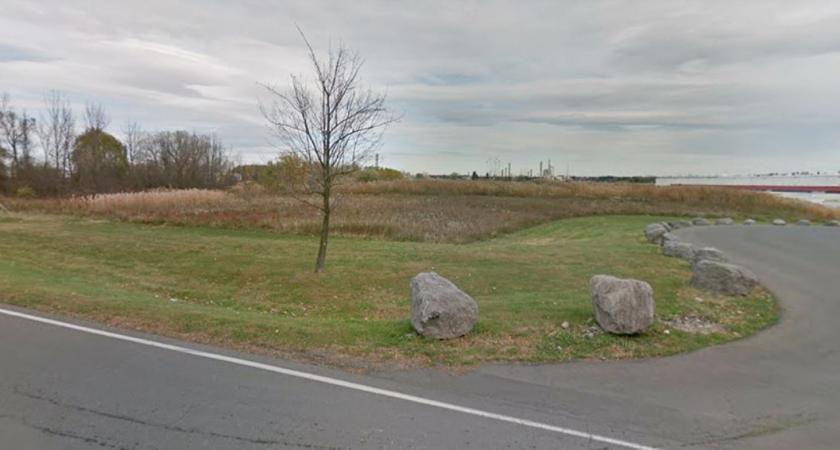
1-Mile | 3-Miles | 5-Miles | ||
---|---|---|---|---|
Total Population | 638 | 8,473 | 32,753 | |
Population Median Age | 43 | 42 | 42 | |
Population by Age | 0-9 Yrs | 67 (10%) | 800 (9%) | 3089 (9%) |
10-19 Yrs | 55 (8%) | 1127 (13%) | 4574 (13%) | |
20-29 Yrs | 81 (12%) | 852 (10%) | 3842 (11%) | |
30-39 Yrs | 101 (15%) | 1136 (13%) | 3509 (10%) | |
40-49 Yrs | 41 (6%) | 1044 (12%) | 4263 (13%) | |
50-59 Yrs | 90 (14%) | 1313 (15%) | 4944 (15%) | |
60-69 Yrs | 114 (17%) | 1112 (13%) | 4466 (13%) | |
70+ Yrs | 89 (13%) | 1090 (12%) | 4065 (12%) | |
Median HH Income | $87,199 | $108,423 | $102,991 | |
Total Household Income | < 24K | 15 (6%) | 214 (6%) | 1022 (7%) |
25-49K | 56 (23%) | 504 (15%) | 2007 (15%) | |
50-74K | 36 (15%) | 362 (10%) | 1665 (12%) | |
75-99K | 21 (8%) | 442 (13%) | 1663 (12%) | |
100-199K | 70 (29%) | 1177 (35%) | 4450 (34%) | |
200K+ | 37 (15%) | 601 (18%) | 2226 (17%) | |
Highest Education Level | No Diploma | 21 | 149 | 601 |
Diploma or GED | 154 | 1188 | 3866 | |
Some College | 110 | 862 | 2718 | |
Assoc. Degree | 49 | 696 | 2551 | |
Bachelors Degree | 58 | 1365 | 5526 | |
Higher Degree | 79 | 1776 | 7433 | |
Total Housing Units | 265 | 3,552 | 13,756 | |
--Owner-Occupied | 172 | 2,473 | 9,869 | |
--Renter-Occupied | 63 | 827 | 3,165 | |
Owner-Occupied Values | < 100K | 5 | 63 | 268 |
100-199K | 48 | 469 | 1902 | |
200-299K | 72 | 813 | 3650 | |
300-399K | 21 | 660 | 2622 | |
400-499K | 8 | 275 | 834 | |
500K+ | 18 | 192 | 592 | |
Total Working Age Population | 532 | 6,940 | 27,020 | |
In Work Force | 313 | 4,443 | 18,025 | |
Not In Work Force | 218 | 2,498 | 8,994 | |
Workforce Employed | 311 | 4,380 | 17,606 | |
Workforce Unemployed | 2 | 32 | 367 | |
Civlian Workforce | 313 | 4,412 | 17,973 | |
Military Workforce | 0 | 31 | 52 | |
Total Households | 234 | 3,300 | 13,034 | |
Family Households | 186 | 2,359 | 8,714 | |
Non-Family Households | 48 | 941 | 4,320 | |
Married Couple | 137 | 1,999 | 7,484 | |
Other Family | 49 | 360 | 1,230 | |
Married w/Child | 28 | 773 | 3,018 | |
Single Male w/Child | 15 | 104 | 269 | |
Single Female w/Child | 16 | 113 | 396 |
Population Change Last Two Decades - Plus Projection
2000 | % | 2010 | % | 2020 | % | 2030 | |
---|---|---|---|---|---|---|---|
New York | 18,976,457 | +2 | 19,378,102 | +4 | 20,146,131 | +2 | 20,604,030 |
Albany County | 294,565 | +3 | 304,204 | +3 | 312,945 | +3 | 322,394 |
Columbia County | 63,094 | 0 | 63,096 | -5 | 59,939 | -5 | 57,200 |
Rensselaer County | 152,538 | +5 | 159,429 | +1 | 161,140 | +1 | 161,946 |
Total Working Age Population:
Total Households:
Total Working Age Population:
Total Households:
Total Working Age Population:
Total Households: