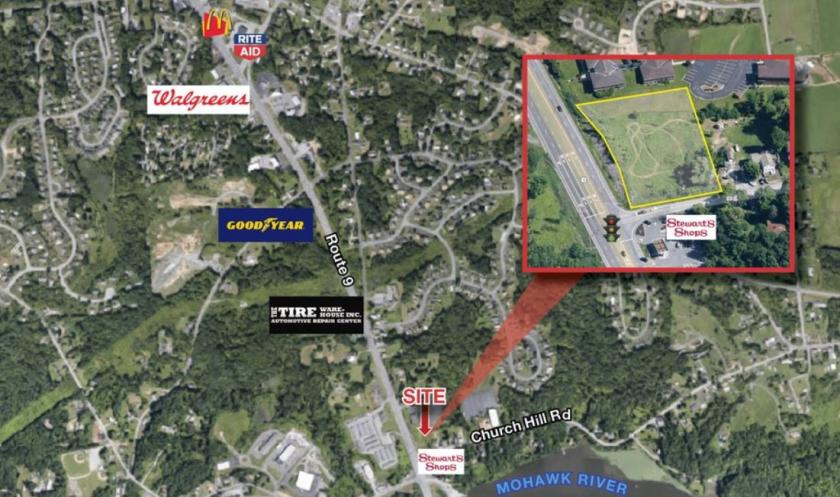
1-Mile | 3-Miles | 5-Miles | ||
---|---|---|---|---|
Total Population | 3,726 | 32,432 | 96,142 | |
Population Median Age | 42 | 40 | 40 | |
Population by Age | 0-9 Yrs | 395 (10%) | 3719 (11%) | 11502 (11%) |
10-19 Yrs | 300 (8%) | 3195 (9%) | 10885 (11%) | |
20-29 Yrs | 443 (11%) | 4450 (13%) | 12754 (13%) | |
30-39 Yrs | 610 (16%) | 5064 (15%) | 13828 (14%) | |
40-49 Yrs | 392 (10%) | 4024 (12%) | 11885 (12%) | |
50-59 Yrs | 704 (18%) | 4705 (14%) | 13165 (13%) | |
60-69 Yrs | 589 (15%) | 4108 (12%) | 12002 (12%) | |
70+ Yrs | 292 (7%) | 3167 (9%) | 10121 (10%) | |
Median HH Income | $99,267 | $85,472 | $72,193 | |
Total Household Income | < 24K | 125 (7%) | 1429 (10%) | 6158 (15%) |
25-49K | 288 (17%) | 2394 (16%) | 7742 (19%) | |
50-74K | 256 (15%) | 2454 (17%) | 7024 (17%) | |
75-99K | 158 (9%) | 1860 (13%) | 5623 (13%) | |
100-199K | 653 (39%) | 4543 (32%) | 10781 (26%) | |
200K+ | 164 (9%) | 1431 (10%) | 3123 (7%) | |
Highest Education Level | No Diploma | 180 | 1417 | 5182 |
Diploma or GED | 542 | 5176 | 16743 | |
Some College | 557 | 4072 | 11700 | |
Assoc. Degree | 328 | 2865 | 8345 | |
Bachelors Degree | 641 | 5596 | 14935 | |
Higher Degree | 561 | 4495 | 10549 | |
Total Housing Units | 1,710 | 15,021 | 44,181 | |
--Owner-Occupied | 1,278 | 9,371 | 23,784 | |
--Renter-Occupied | 366 | 4,740 | 16,667 | |
Owner-Occupied Values | < 100K | 82 | 894 | 2735 |
100-199K | 246 | 1865 | 6391 | |
200-299K | 551 | 3612 | 7514 | |
300-399K | 204 | 1635 | 3977 | |
400-499K | 145 | 986 | 2119 | |
500K+ | 51 | 379 | 1048 | |
Total Working Age Population | 3,128 | 26,758 | 77,841 | |
In Work Force | 2,338 | 19,189 | 53,280 | |
Not In Work Force | 789 | 7,569 | 24,562 | |
Workforce Employed | 2,281 | 18,511 | 50,882 | |
Workforce Unemployed | 54 | 617 | 2,236 | |
Civlian Workforce | 2,334 | 19,128 | 53,118 | |
Military Workforce | 4 | 62 | 162 | |
Total Households | 1,644 | 14,111 | 40,451 | |
Family Households | 1,037 | 8,543 | 24,280 | |
Non-Family Households | 606 | 5,568 | 16,171 | |
Married Couple | 788 | 6,433 | 17,634 | |
Other Family | 249 | 2,110 | 6,647 | |
Married w/Child | 259 | 2,443 | 6,776 | |
Single Male w/Child | 5 | 170 | 659 | |
Single Female w/Child | 84 | 815 | 2,586 |
Population Change Last Two Decades - Plus Projection
2000 | % | 2010 | % | 2020 | % | 2030 | |
---|---|---|---|---|---|---|---|
New York | 18,976,457 | +2 | 19,378,102 | +4 | 20,146,131 | +2 | 20,604,030 |
Albany County | 294,565 | +3 | 304,204 | +3 | 312,945 | +3 | 322,394 |
Rensselaer County | 152,538 | +5 | 159,429 | +1 | 161,140 | +1 | 161,946 |
Saratoga County | 200,635 | +9 | 219,607 | +7 | 234,009 | +5 | 246,743 |
Schenectady County | 146,555 | +6 | 154,727 | +1 | 156,103 | +1 | 157,575 |
Total Working Age Population:
Total Households:
Total Working Age Population:
Total Households:
Total Working Age Population:
Total Households: