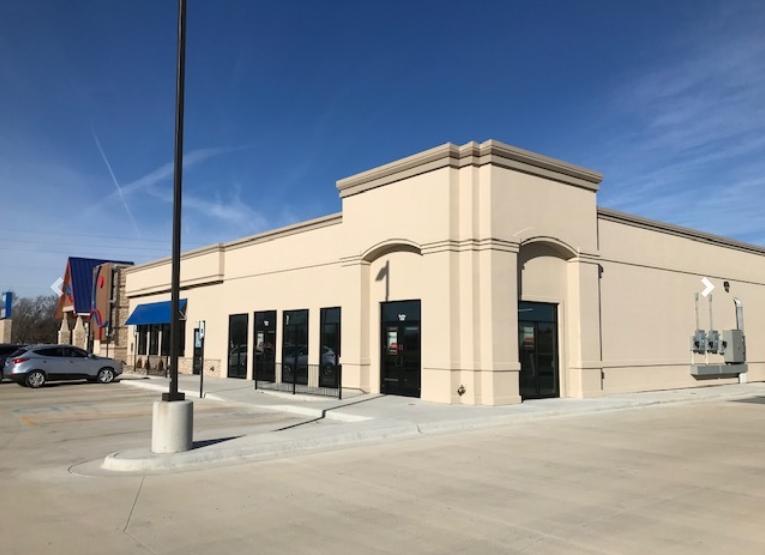
Retail Space
3204 North Maize Road Wichita, KS 67205
3204 North Maize Road Wichita, KS 67205
Details & Description
Property Highlights
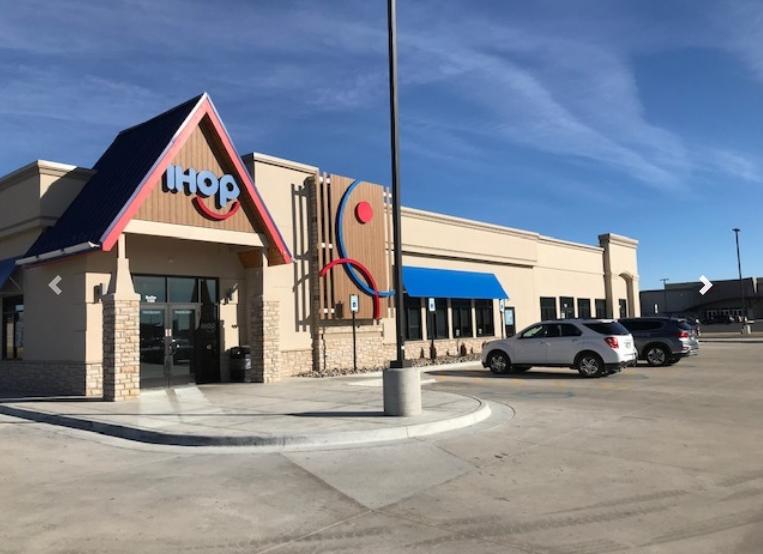
- • Adjacent to IHOP
- • 29th Maize Rd Traffic Count 28,659 VPD
- • Doorside Parking
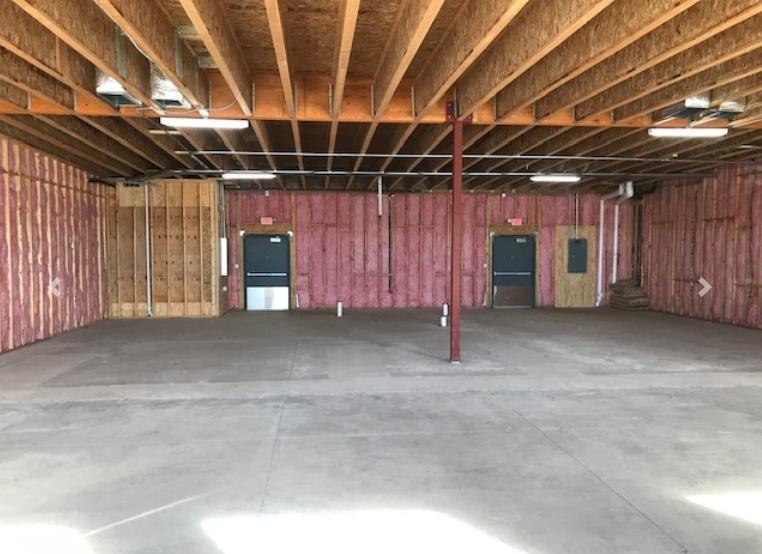
Additional Photos

Listing Agents

Troy Farha
O: 316-847-4904
M: 316-650-6555
tfarha@naimartens.com
O: 316-847-4904
M: 316-650-6555
tfarha@naimartens.com
While we strive to provide the most accurate information, all listing information, and demographic data, is provided by third-parties. As such, MyEListing will not be responsible for the accuracy of the information. It is strongly recommended that you verify all information with the listing agent, and any relevant agencies, prior to making any decisions.


