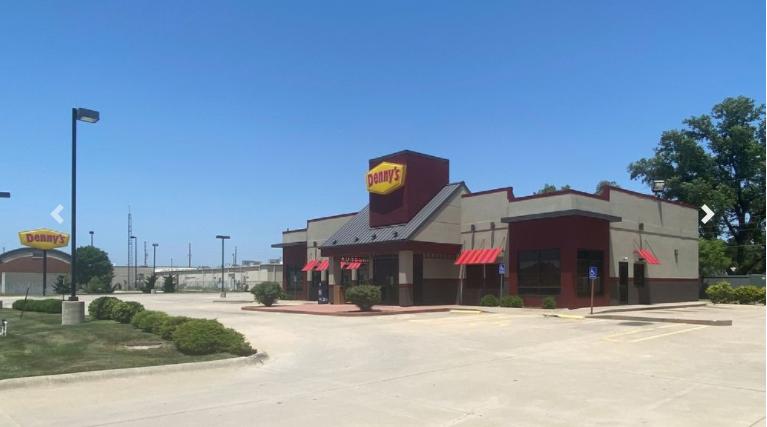
Retail Space
8030 East Kellogg Drive Wichita, KS 67208
8030 East Kellogg Drive Wichita, KS 67208

Details & Description
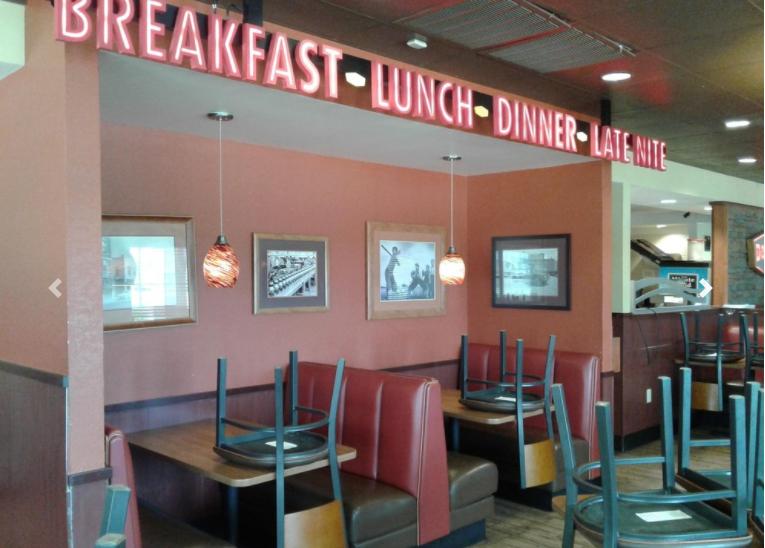
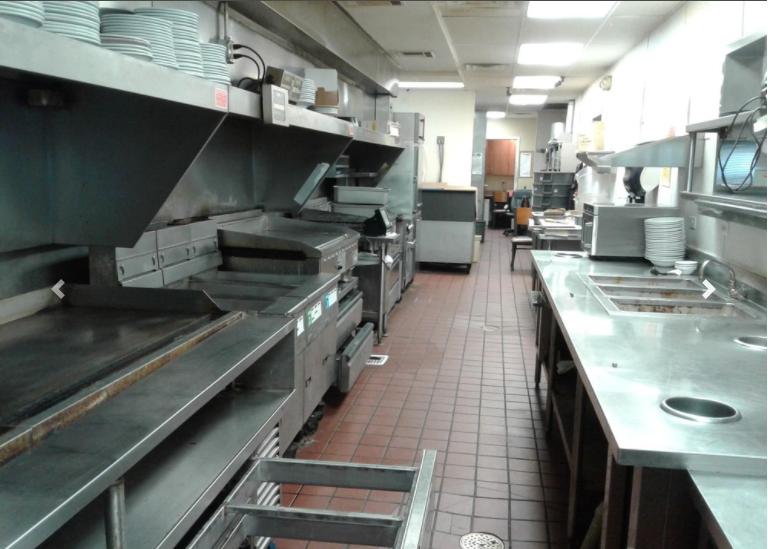
Additional Photos
Listing Agents

Troy Farha
O: 316-847-4904
M: 316-650-6555
tfarha@naimartens.com
O: 316-847-4904
M: 316-650-6555
tfarha@naimartens.com

Patrick Ahern
O: 316-847-4914
M: 316-253-0660
pahern@naimartens.com
O: 316-847-4914
M: 316-253-0660
pahern@naimartens.com
While we strive to provide the most accurate information, all listing information, and demographic data, is provided by third-parties. As such, MyEListing will not be responsible for the accuracy of the information. It is strongly recommended that you verify all information with the listing agent, and any relevant agencies, prior to making any decisions.


