Office Space
12219 East Central Avenue Wichita, KS 67206
12219 East Central Avenue Wichita, KS 67206
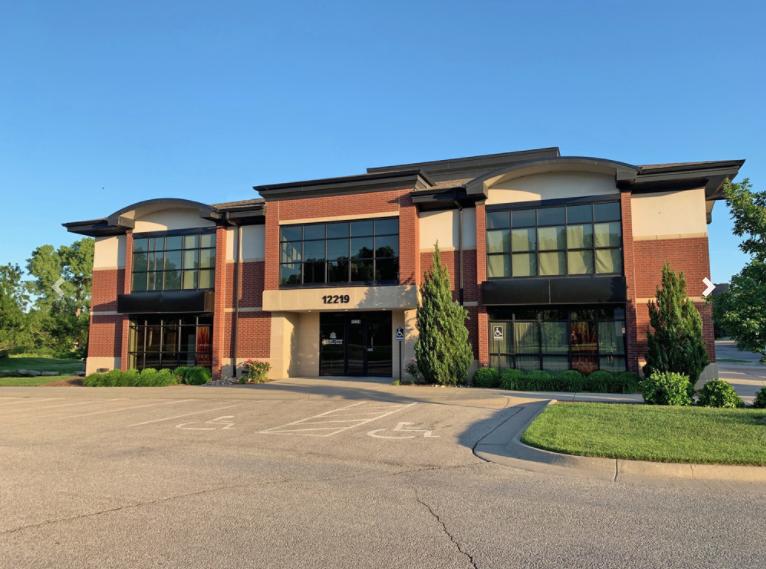
Details & Description
Property Highlights
- • Two-Story Class A OfficeMedical Building
- • For Sale or For Lease
- • Common Area- 1,023 SF
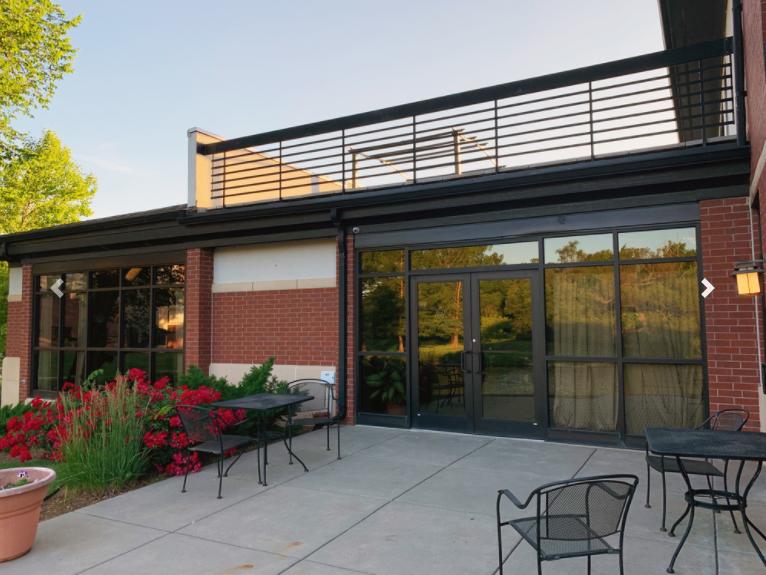
Additional Photos


Listing Agents

Trent Garman
O: 316-613-2447
M: 316-210-2061
tgarman@naimartens.com
O: 316-613-2447
M: 316-210-2061
tgarman@naimartens.com
While we strive to provide the most accurate information, all listing information, and demographic data, is provided by third-parties. As such, MyEListing will not be responsible for the accuracy of the information. It is strongly recommended that you verify all information with the listing agent, and any relevant agencies, prior to making any decisions.


