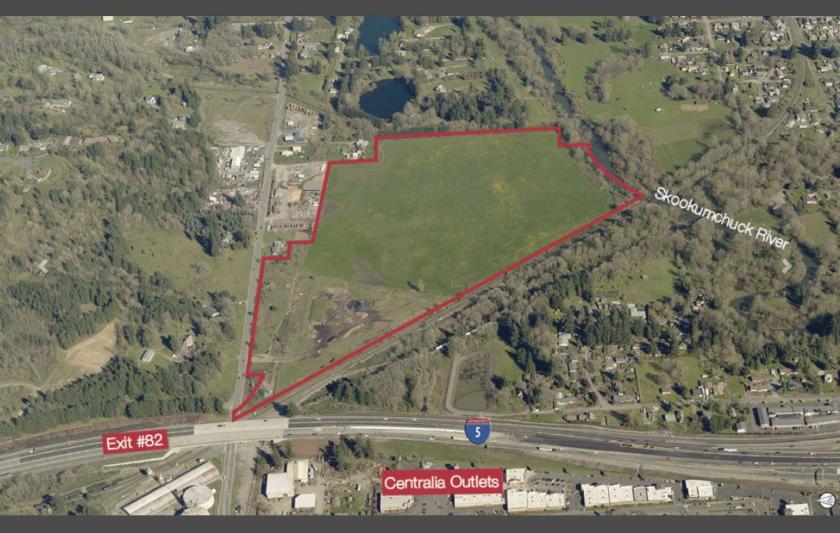
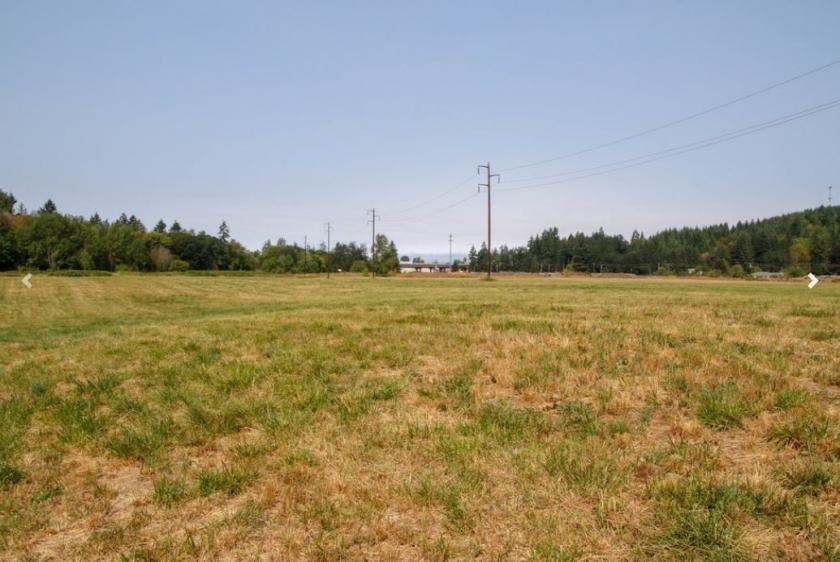
1-Mile | 3-Miles | 5-Miles | ||
---|---|---|---|---|
Total Population | 4,857 | 21,813 | 29,759 | |
Population Median Age | 39 | 40 | 39 | |
Population by Age | 0-9 Yrs | 598 (12%) | 2802 (12%) | 3934 (13%) |
10-19 Yrs | 675 (13%) | 2918 (13%) | 3874 (13%) | |
20-29 Yrs | 564 (11%) | 2749 (12%) | 3963 (13%) | |
30-39 Yrs | 641 (13%) | 2815 (12%) | 4072 (13%) | |
40-49 Yrs | 661 (13%) | 2539 (11%) | 3422 (11%) | |
50-59 Yrs | 561 (11%) | 2359 (10%) | 3316 (11%) | |
60-69 Yrs | 686 (14%) | 2808 (12%) | 3636 (12%) | |
70+ Yrs | 471 (9%) | 2822 (12%) | 3540 (11%) | |
Median HH Income | $44,965 | $47,091 | $49,693 | |
Total Household Income | < 24K | 522 (26%) | 2261 (26%) | 2895 (25%) |
25-49K | 506 (25%) | 2291 (26%) | 2877 (25%) | |
50-74K | 336 (17%) | 1633 (18%) | 2186 (19%) | |
75-99K | 346 (17%) | 1169 (13%) | 1627 (14%) | |
100-199K | 207 (10%) | 1112 (12%) | 1639 (14%) | |
200K+ | 37 (1%) | 181 (2%) | 259 (2%) | |
Highest Education Level | No Diploma | 662 | 2295 | 2963 |
Diploma or GED | 896 | 4451 | 5964 | |
Some College | 814 | 3878 | 5325 | |
Assoc. Degree | 376 | 1769 | 2393 | |
Bachelors Degree | 317 | 1520 | 2074 | |
Higher Degree | 231 | 962 | 1326 | |
Total Housing Units | 2,146 | 9,256 | 12,283 | |
--Owner-Occupied | 1,115 | 5,062 | 6,912 | |
--Renter-Occupied | 840 | 3,583 | 4,571 | |
Owner-Occupied Values | < 100K | 164 | 830 | 1073 |
100-199K | 549 | 2114 | 2709 | |
200-299K | 296 | 1361 | 1791 | |
300-399K | 87 | 391 | 754 | |
400-499K | 14 | 179 | 276 | |
500K+ | 5 | 186 | 310 | |
Total Working Age Population | 3,808 | 17,153 | 23,398 | |
In Work Force | 2,196 | 9,307 | 13,119 | |
Not In Work Force | 1,612 | 7,846 | 10,279 | |
Workforce Employed | 2,066 | 8,541 | 12,092 | |
Workforce Unemployed | 120 | 716 | 958 | |
Civlian Workforce | 2,186 | 9,258 | 13,051 | |
Military Workforce | 10 | 49 | 68 | |
Total Households | 1,955 | 8,645 | 11,483 | |
Family Households | 1,071 | 4,937 | 6,865 | |
Non-Family Households | 884 | 3,708 | 4,618 | |
Married Couple | 776 | 3,493 | 4,856 | |
Other Family | 295 | 1,445 | 2,009 | |
Married w/Child | 394 | 1,503 | 2,080 | |
Single Male w/Child | 26 | 197 | 325 | |
Single Female w/Child | 104 | 518 | 707 |
Population Change Last Two Decades - Plus Projection
2000 | % | 2010 | % | 2020 | % | 2030 | |
---|---|---|---|---|---|---|---|
Washington | 5,894,121 | +14 | 6,724,540 | +14 | 7,638,415 | +11 | 8,503,178 |
Lewis County | 68,600 | +10 | 75,455 | +6 | 80,220 | +7 | 85,438 |
Thurston County | 207,355 | +22 | 252,264 | +17 | 294,333 | +14 | 335,965 |
Total Working Age Population:
Total Households:
Total Working Age Population:
Total Households:
Total Working Age Population:
Total Households: