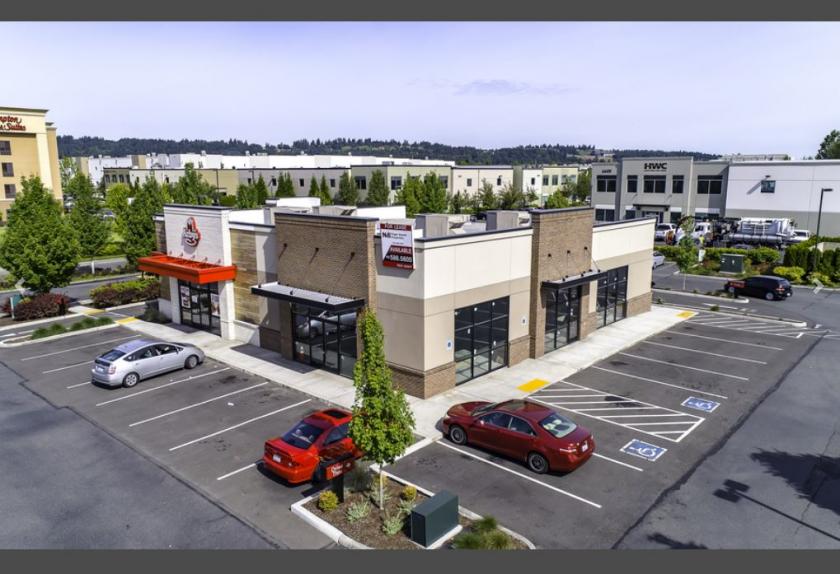
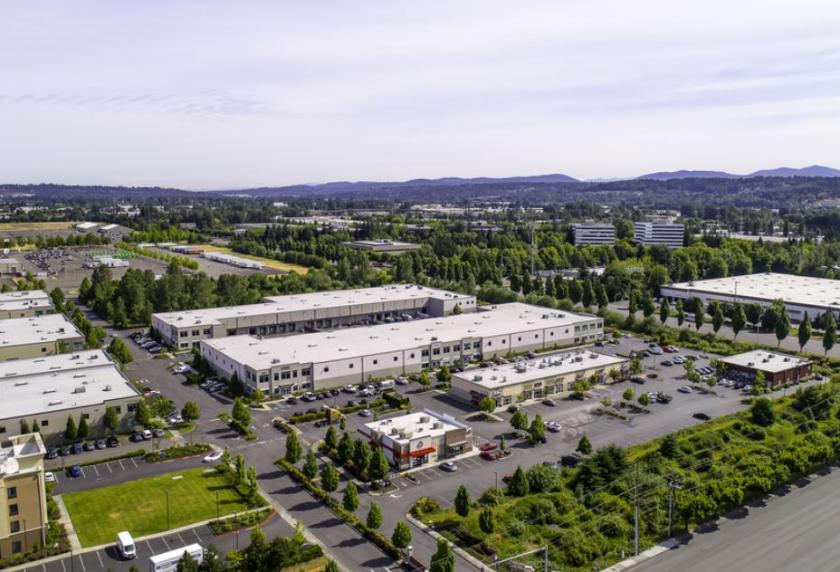
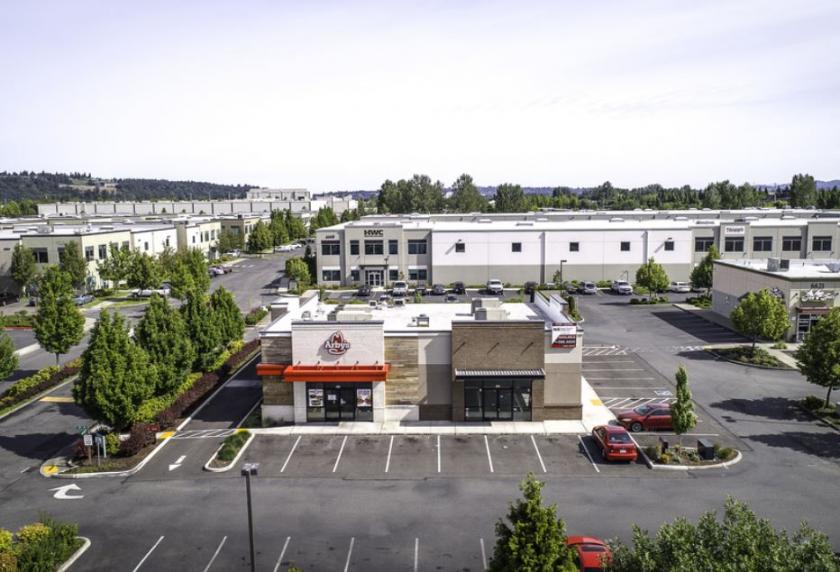
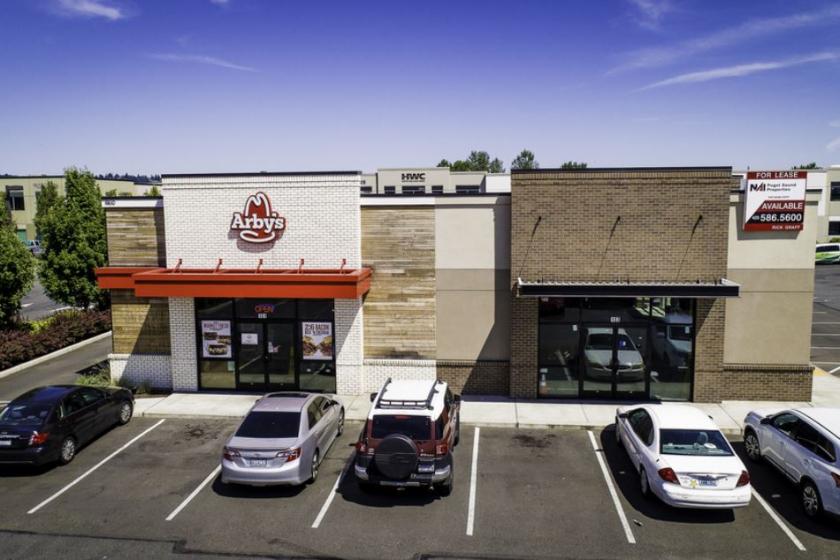
1-Mile | 3-Miles | 5-Miles | ||
---|---|---|---|---|
Total Population | 538 | 87,725 | 263,997 | |
Population Median Age | 35 | 36 | 37 | |
Population by Age | 0-9 Yrs | 81 (15%) | 12083 (13%) | 35402 (13%) |
10-19 Yrs | 55 (10%) | 9934 (11%) | 30734 (11%) | |
20-29 Yrs | 66 (12%) | 14932 (17%) | 41724 (15%) | |
30-39 Yrs | 123 (22%) | 14007 (15%) | 41763 (15%) | |
40-49 Yrs | 70 (13%) | 11959 (13%) | 34302 (12%) | |
50-59 Yrs | 75 (13%) | 9798 (11%) | 31987 (12%) | |
60-69 Yrs | 45 (8%) | 8017 (9%) | 27237 (10%) | |
70+ Yrs | 22 (4%) | 6995 (7%) | 20848 (7%) | |
Median HH Income | $77,460 | $66,422 | $70,157 | |
Total Household Income | < 24K | 39 (17%) | 4823 (15%) | 13002 (13%) |
25-49K | 31 (13%) | 6476 (20%) | 18939 (20%) | |
50-74K | 38 (16%) | 6597 (21%) | 18845 (19%) | |
75-99K | 53 (23%) | 4316 (13%) | 13099 (13%) | |
100-199K | 57 (25%) | 7610 (24%) | 24759 (26%) | |
200K+ | 8 (3%) | 1589 (5%) | 5879 (6%) | |
Highest Education Level | No Diploma | 52 | 8468 | 23786 |
Diploma or GED | 73 | 15708 | 44907 | |
Some College | 94 | 14286 | 42433 | |
Assoc. Degree | 47 | 5805 | 18555 | |
Bachelors Degree | 77 | 10772 | 35622 | |
Higher Degree | 28 | 4005 | 14091 | |
Total Housing Units | 304 | 33,440 | 99,966 | |
--Owner-Occupied | 131 | 14,792 | 49,153 | |
--Renter-Occupied | 95 | 16,619 | 45,370 | |
Owner-Occupied Values | < 100K | 29 | 1521 | 2952 |
100-199K | 13 | 1161 | 3602 | |
200-299K | 32 | 3432 | 10184 | |
300-399K | 37 | 4159 | 14393 | |
400-499K | 18 | 2667 | 9901 | |
500K+ | 3 | 1852 | 8120 | |
Total Working Age Population | 411 | 69,547 | 210,027 | |
In Work Force | 314 | 47,329 | 144,787 | |
Not In Work Force | 97 | 22,218 | 65,241 | |
Workforce Employed | 296 | 44,536 | 136,878 | |
Workforce Unemployed | 18 | 2,699 | 7,707 | |
Civlian Workforce | 314 | 47,235 | 144,585 | |
Military Workforce | 0 | 94 | 202 | |
Total Households | 226 | 31,411 | 94,523 | |
Family Households | 118 | 19,768 | 62,130 | |
Non-Family Households | 109 | 11,643 | 32,393 | |
Married Couple | 83 | 12,780 | 42,484 | |
Other Family | 34 | 6,987 | 19,646 | |
Married w/Child | 47 | 5,924 | 18,716 | |
Single Male w/Child | 0 | 1,083 | 2,966 | |
Single Female w/Child | 16 | 2,262 | 7,038 |
Population Change Last Two Decades - Plus Projection
2000 | % | 2010 | % | 2020 | % | 2030 | |
---|---|---|---|---|---|---|---|
Washington | 5,894,121 | +14 | 6,724,540 | +14 | 7,638,415 | +11 | 8,503,178 |
King County | 1,737,034 | +11 | 1,931,249 | +16 | 2,231,408 | +11 | 2,474,625 |
Pierce County | 700,820 | +13 | 795,225 | +13 | 901,251 | +11 | 1,002,412 |
Total Working Age Population:
Total Households:
Total Working Age Population:
Total Households:
Total Working Age Population:
Total Households: