Flex-Office-Warehouse
525 North Baer Street McPherson, KS 67460
525 North Baer Street McPherson, KS 67460
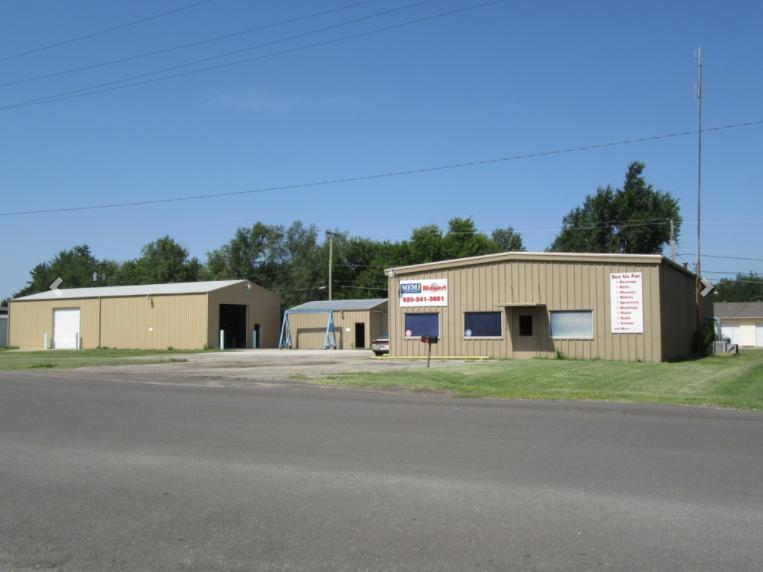
Details & Description
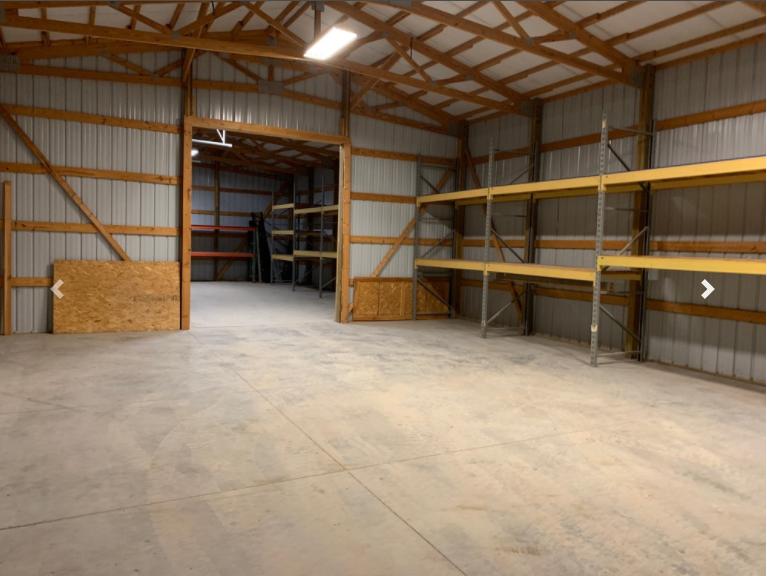
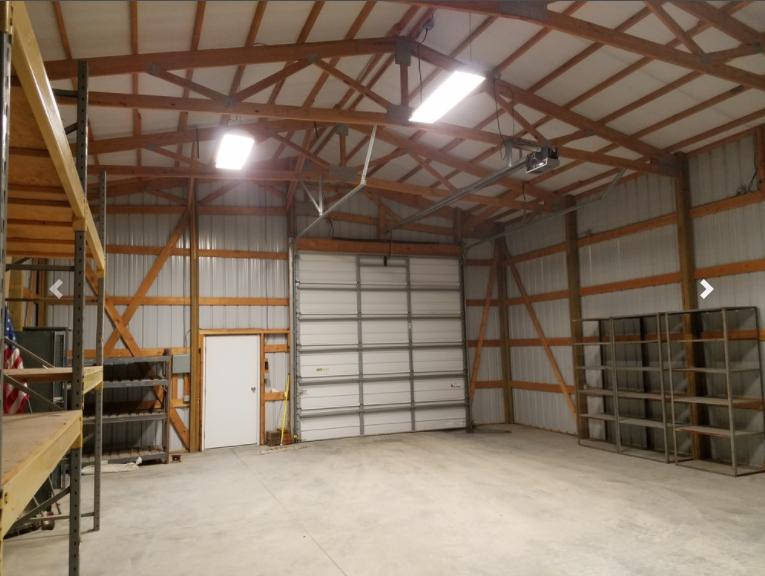
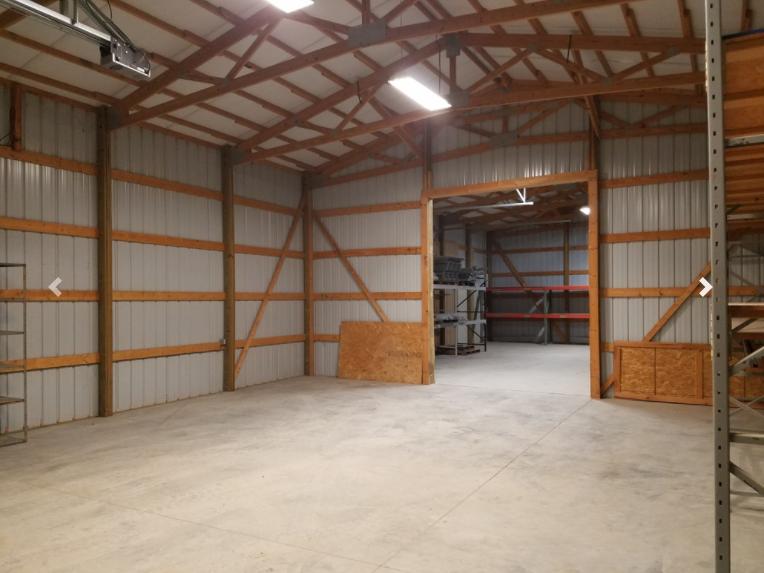
Additional Photos
Listing Agents

Ryan Hubbard
O: 316-613-2448
M: 316-990-2994
rhubbard@naimartens.com
O: 316-613-2448
M: 316-990-2994
rhubbard@naimartens.com
While we strive to provide the most accurate information, all listing information, and demographic data, is provided by third-parties. As such, MyEListing will not be responsible for the accuracy of the information. It is strongly recommended that you verify all information with the listing agent, and any relevant agencies, prior to making any decisions.


