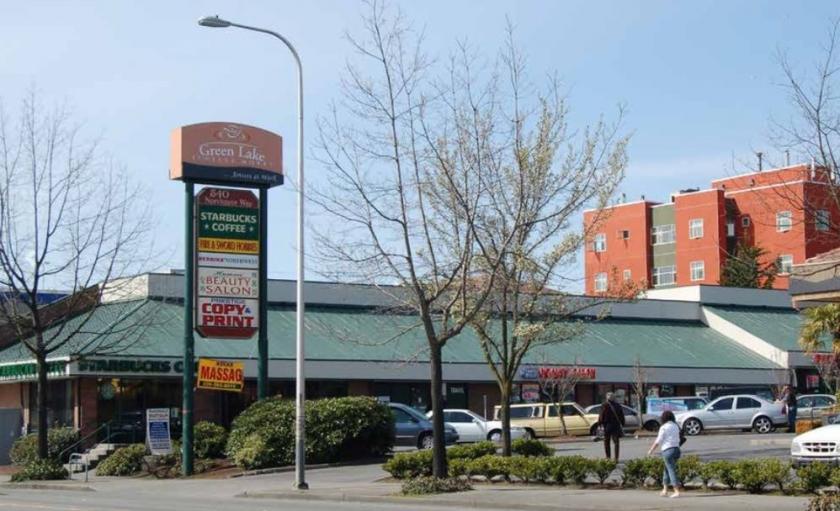
Retail Space
540 Northeast Northgate Way Seattle, WA 98125
540 Northeast Northgate Way Seattle, WA 98125
Details & Description
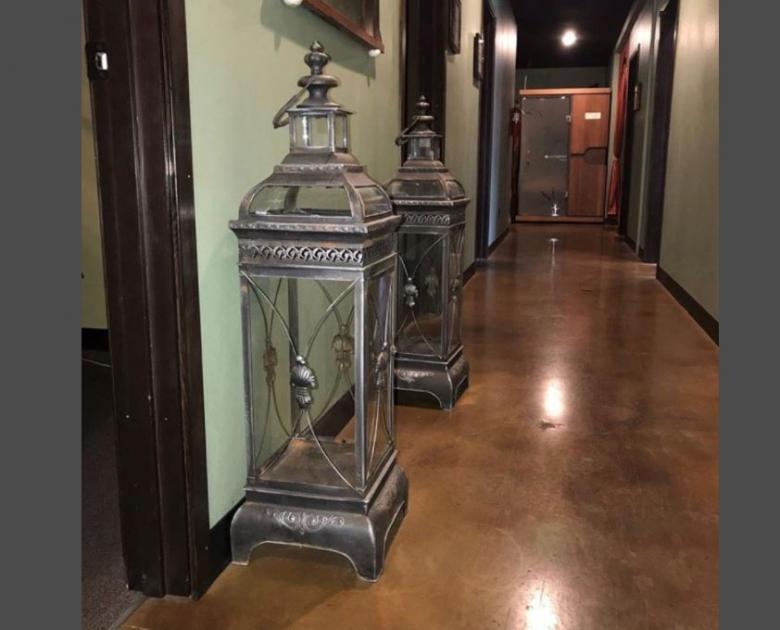
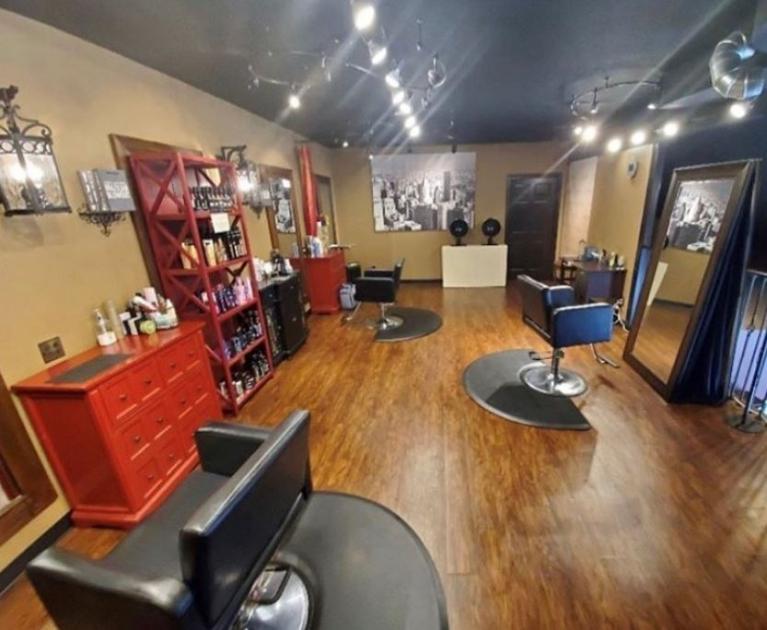
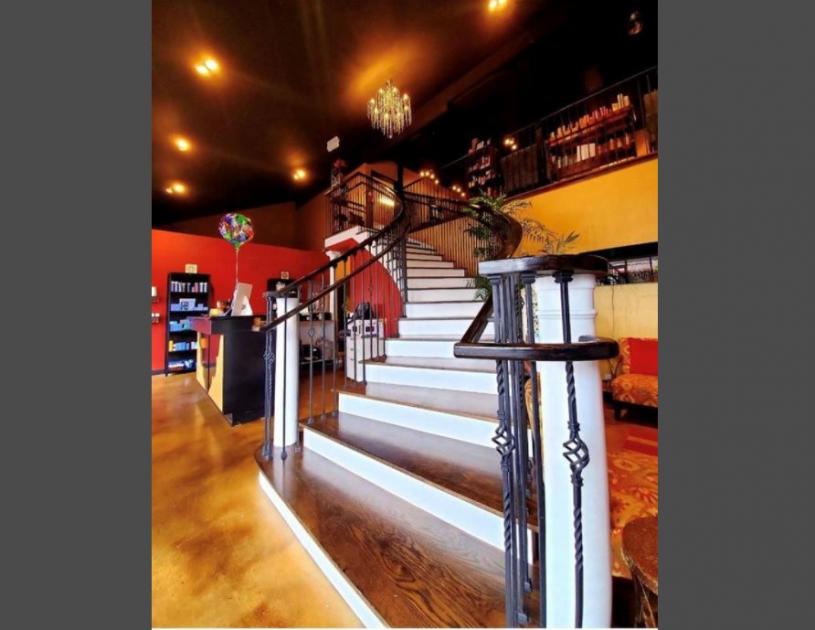
Additional Photos
Listing Agents

Ryan Olson
O: 425-586-5646
M: 425-922-3879
rolson@nai-psp.com
O: 425-586-5646
M: 425-922-3879
rolson@nai-psp.com
While we strive to provide the most accurate information, all listing information, and demographic data, is provided by third-parties. As such, MyEListing will not be responsible for the accuracy of the information. It is strongly recommended that you verify all information with the listing agent, and any relevant agencies, prior to making any decisions.


