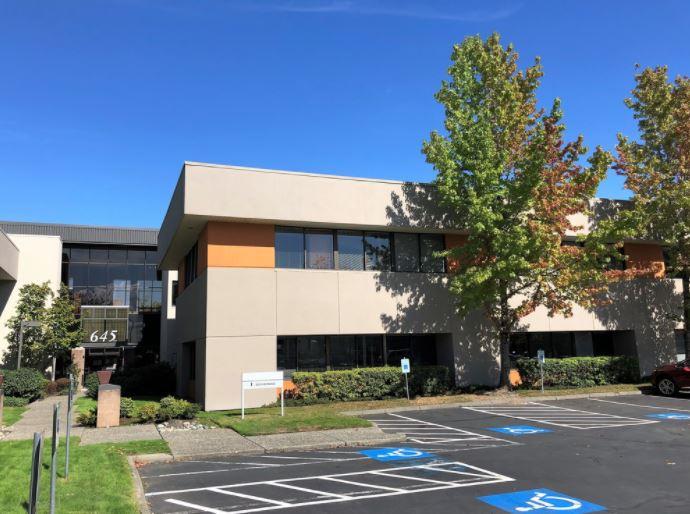
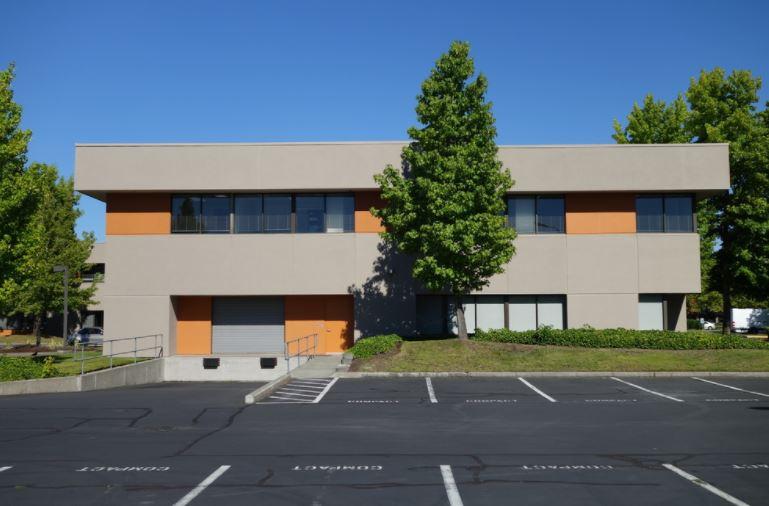
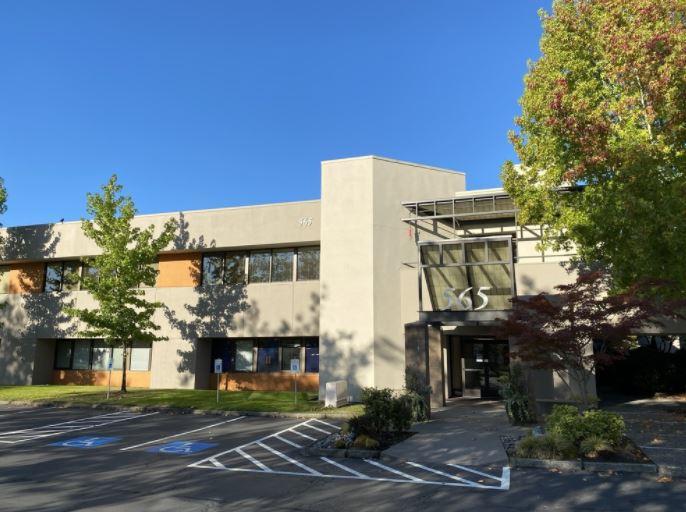
10-building, 200,000 SF office campus, centrally located in Southcenter
On-site amenities include a 50-person conference room, fitness center and two-story atrium lounge
Several improvements planned for 2021, including updated common areas and new restrooms
Abundant parking; ratio of 4+/1,000 SF
No local business & occupation tax
Strong & responsive local ownership
Several high-speed & fiber internet providers available
Lease Rate: $25.00 PSF, Full Service
No part of this information may be copied, reproduced, repurposed, or screen-captured for any commercial purpose without prior written authorization from MyEListing.
While we strive to provide the most accurate information, all listing information, and demographic data, is provided by third-parties. As such, MyEListing will not be responsible for the accuracy of the information. It is strongly recommended that you verify all information with the listing agent, and any relevant agencies, prior to making any decisions.
What is the asking price for 545 Andover Park West in Tukwila?
The asking price for 545 Andover Park West is $25.00 a SF per Year
What is the building size of this commercial Office property?
The size of this multi-unit property varies between 771 - 10950 square feet
What kind of Office is the propery at 545 Andover Park West?
The property at 545 Andover Park West Tukwila, WA 98188 is listed as a Professional Office property
What is the population within 1 mile of 545 Andover Park West in Tukwila?
The population within 1 mile of 545 Andover Park West Tukwila, WA 98188 is 3,702 people.
Who do I contact for questions about 545 Andover Park West?
You should contact the listing agent,
Mike George, for any details regarding this commercial listing.