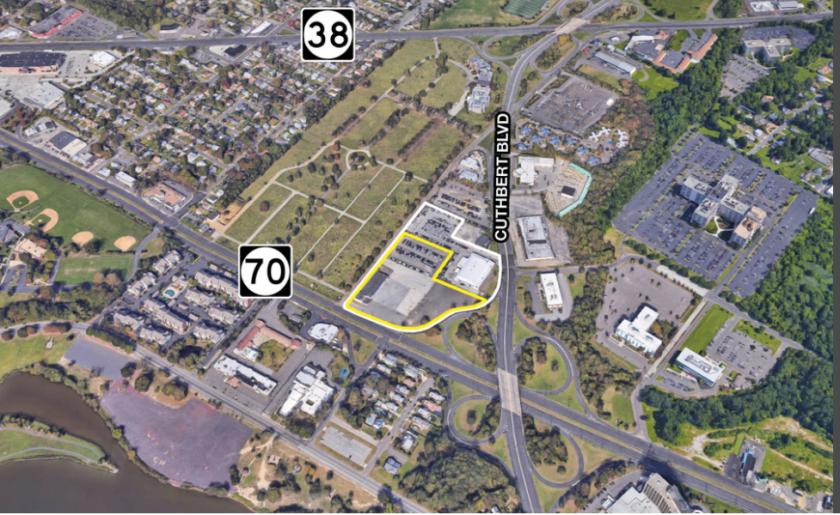
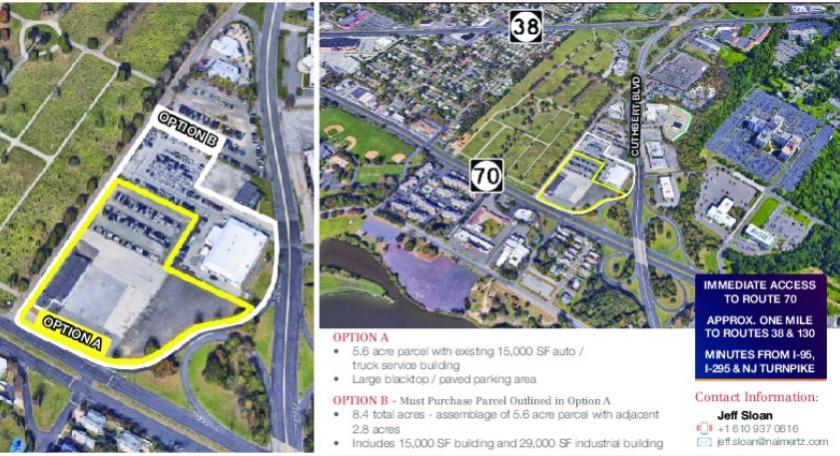
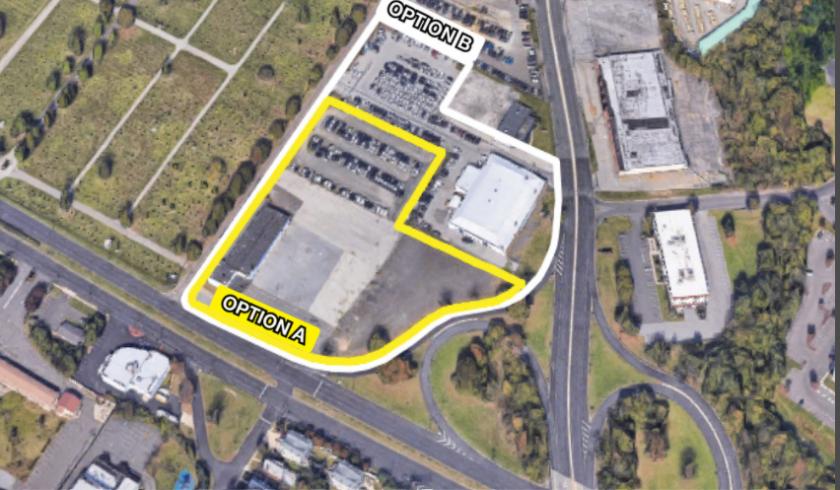
1-Mile | 3-Miles | 5-Miles | ||
---|---|---|---|---|
Total Population | 11,491 | 159,411 | 372,734 | |
Population Median Age | 41 | 38 | 38 | |
Population by Age | 0-9 Yrs | 1211 (10%) | 21038 (13%) | 47393 (12%) |
10-19 Yrs | 1218 (10%) | 21816 (13%) | 45023 (12%) | |
20-29 Yrs | 1313 (11%) | 20319 (12%) | 51265 (13%) | |
30-39 Yrs | 1639 (14%) | 22425 (14%) | 58676 (15%) | |
40-49 Yrs | 1615 (14%) | 20485 (12%) | 46294 (12%) | |
50-59 Yrs | 1740 (15%) | 21462 (13%) | 49309 (13%) | |
60-69 Yrs | 1567 (13%) | 16604 (10%) | 39421 (10%) | |
70+ Yrs | 1188 (10%) | 15263 (9%) | 35354 (9%) | |
Median HH Income | $80,573 | $60,397 | $65,874 | |
Total Household Income | < 24K | 611 (13%) | 14205 (24%) | 30509 (21%) |
25-49K | 679 (14%) | 11336 (19%) | 26656 (18%) | |
50-74K | 872 (18%) | 8807 (14%) | 21808 (15%) | |
75-99K | 621 (13%) | 6899 (11%) | 17643 (12%) | |
100-199K | 1349 (29%) | 13364 (22%) | 34247 (23%) | |
200K+ | 469 (10%) | 4371 (7%) | 12307 (8%) | |
Highest Education Level | No Diploma | 970 | 16387 | 33023 |
Diploma or GED | 2010 | 30091 | 74924 | |
Some College | 1442 | 20682 | 45795 | |
Assoc. Degree | 664 | 7293 | 16893 | |
Bachelors Degree | 1864 | 20145 | 53626 | |
Higher Degree | 1551 | 12113 | 35432 | |
Total Housing Units | 5,196 | 66,040 | 159,492 | |
--Owner-Occupied | 3,177 | 35,320 | 87,144 | |
--Renter-Occupied | 1,424 | 23,660 | 56,026 | |
Owner-Occupied Values | < 100K | 243 | 7112 | 13471 |
100-199K | 1246 | 12129 | 30170 | |
200-299K | 1028 | 9359 | 23412 | |
300-399K | 485 | 3309 | 9790 | |
400-499K | 134 | 1432 | 3755 | |
500K+ | 42 | 1978 | 6545 | |
Total Working Age Population | 9,508 | 124,672 | 297,598 | |
In Work Force | 6,549 | 81,863 | 198,054 | |
Not In Work Force | 2,959 | 42,809 | 99,544 | |
Workforce Employed | 6,155 | 75,861 | 184,891 | |
Workforce Unemployed | 378 | 5,924 | 12,958 | |
Civlian Workforce | 6,533 | 81,785 | 197,849 | |
Military Workforce | 16 | 78 | 205 | |
Total Households | 4,602 | 58,980 | 143,170 | |
Family Households | 2,871 | 38,724 | 88,203 | |
Non-Family Households | 1,731 | 20,256 | 54,967 | |
Married Couple | 2,202 | 23,061 | 55,419 | |
Other Family | 669 | 15,663 | 32,784 | |
Married w/Child | 919 | 9,438 | 21,972 | |
Single Male w/Child | 56 | 1,465 | 3,687 | |
Single Female w/Child | 161 | 6,564 | 12,475 |
Population Change Last Two Decades - Plus Projection
2000 | % | 2010 | % | 2020 | % | 2030 | |
---|---|---|---|---|---|---|---|
New Jersey | 8,414,350 | +4 | 8,791,894 | +4 | 9,132,700 | +4 | 9,530,900 |
Burlington County | 423,394 | +6 | 448,734 | 0 | 450,000 | +3 | 464,900 |
Camden County | 508,932 | +1 | 513,657 | 0 | 511,800 | +2 | 521,000 |
Gloucester County | 254,673 | +13 | 288,288 | +1 | 292,000 | +5 | 305,800 |
Pennsylvania | 12,281,054 | +3 | 12,702,379 | +4 | 13,230,170 | +4 | 13,759,594 |
Montgomery County | 750,097 | +7 | 799,874 | +5 | 838,883 | +6 | 891,868 |
Philadelphia County | 1,517,550 | +1 | 1,526,006 | +8 | 1,653,729 | +6 | 1,753,054 |
Total Working Age Population:
Total Households:
Total Working Age Population:
Total Households:
Total Working Age Population:
Total Households: