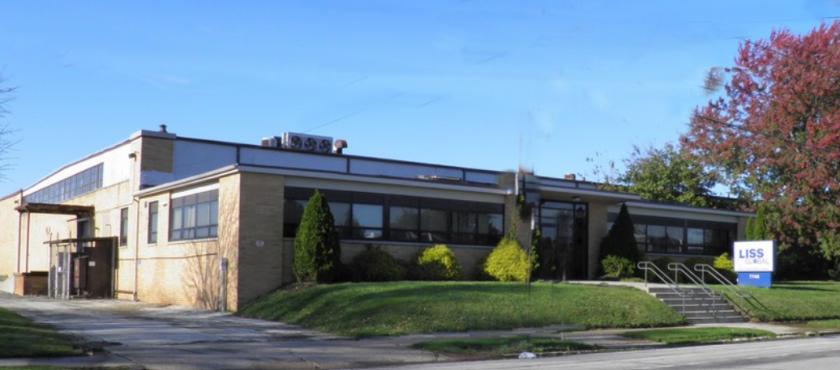
35,000± SF office, showroom and front warehouse section available within 73,667± SF one story industrial building. 2.76± acres with 300’ frontage of Dungan Road.
Highlights:
Front Section: 17’6” x 49’4”
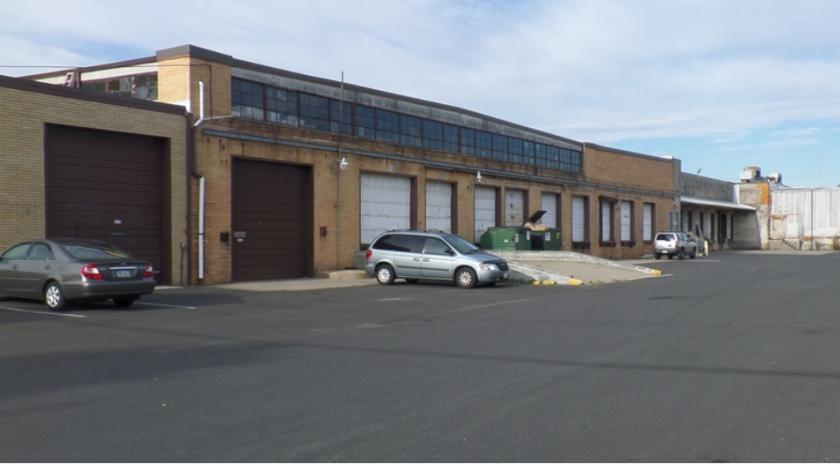
Walls: Brick and block with metal panels along the top
Structure: Steel columns, bar joists and I- beams
Floor: Concrete
Roof: White TPO over the warehouse space and silver coated roofing material over the office area; installed in 2012.
Warehouse: Heated by suspended radiant tube and gas fired units
Office: Heated and cooled by roof mounted combination units
Ceiling Height: 17'
Sprinkler: 100% wet system
Power: 800 amp/3 phase power
Loading: 7 tailgate doors and 4 drive-in doors
Natural Gas: 6” main; supplied by Philadelphia Gas Works
Water/Sewer: 8” main; supplied by City of Philadelphia Water Department
No part of this information may be copied, reproduced, repurposed, or screen-captured for any commercial purpose without prior written authorization from MyEListing.
While we strive to provide the most accurate information, all listing information, and demographic data, is provided by third-parties. As such, MyEListing will not be responsible for the accuracy of the information. It is strongly recommended that you verify all information with the listing agent, and any relevant agencies, prior to making any decisions.
What is the building size of this commercial Flex/Office Whs property?
The size of this lease property at '.7746 Dungan Road.' is 35000 square feet
What is the population within 1 mile of 7746 Dungan Road in Philadelphia?
The population within 1 mile of 7746 Dungan Road Philadelphia, PA 19111 is 37,950 people.
Who do I contact for questions about 7746 Dungan Road?
You should contact the listing agent,
Jeffrey Licht, for any details regarding this commercial listing.