Industrial Properties
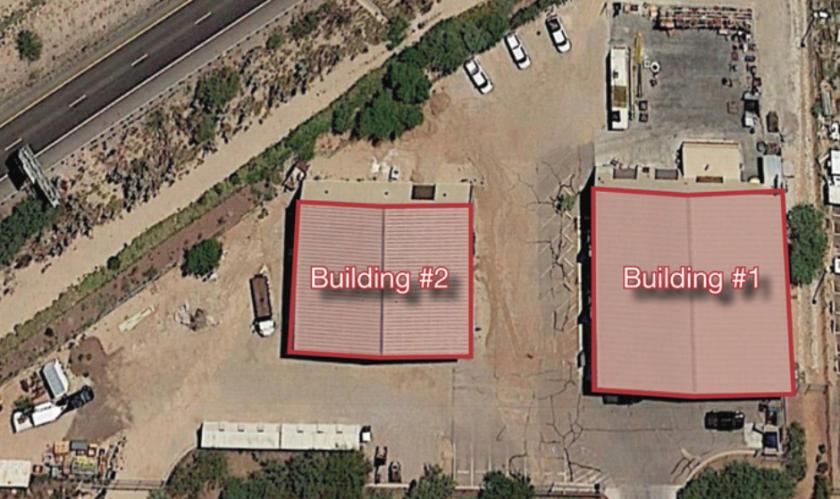
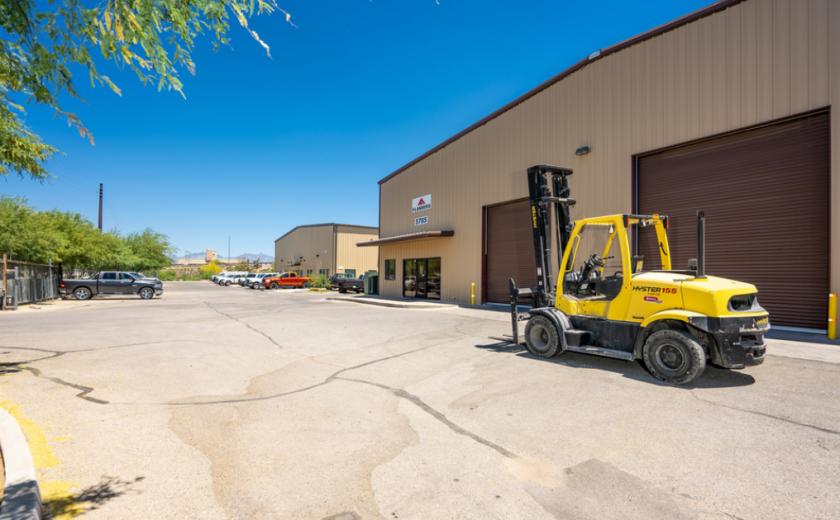
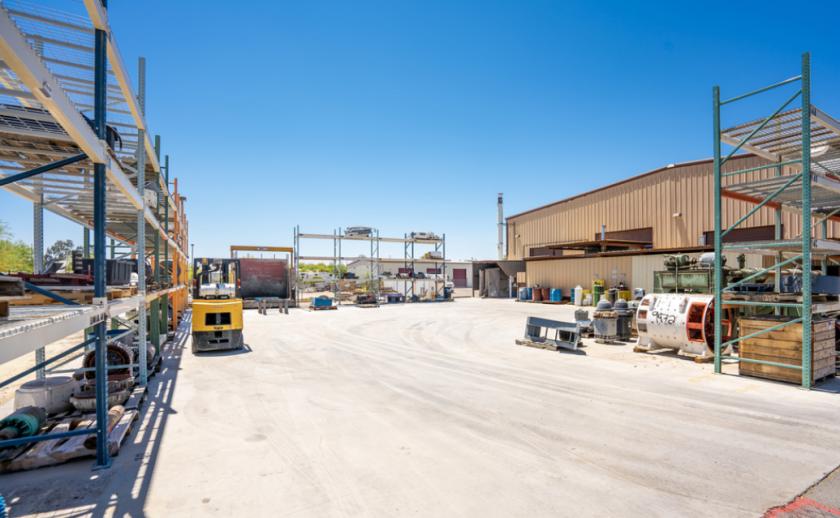
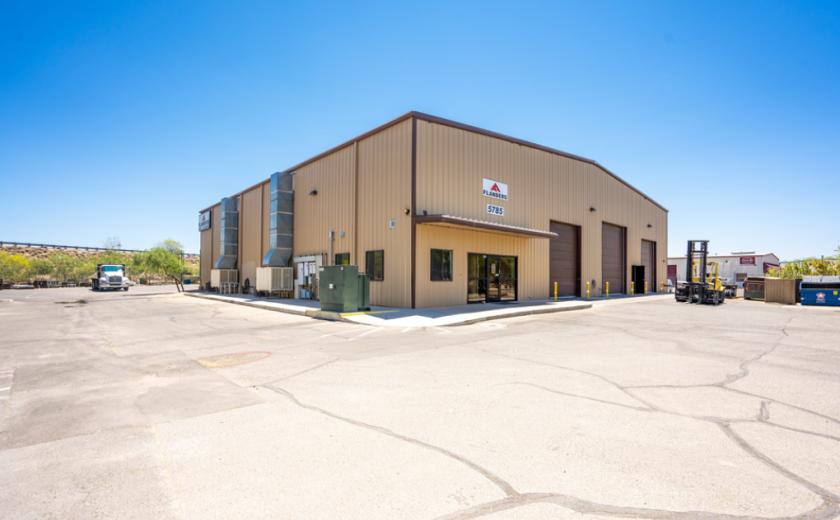
5785 South Belvedere Avenue Tucson, AZ 85706
5785 South Belvedere Avenue Tucson, AZ 85706
Details & Description
Additional Photos

Listing Agents

David Blanchette
O: 520-729-1697
M: 520-906-9446
david.blanchette@naihorizon.com
O: 520-729-1697
M: 520-906-9446
david.blanchette@naihorizon.com
While we strive to provide the most accurate information, all listing information, and demographic data, is provided by third-parties. As such, MyEListing will not be responsible for the accuracy of the information. It is strongly recommended that you verify all information with the listing agent, and any relevant agencies, prior to making any decisions.


