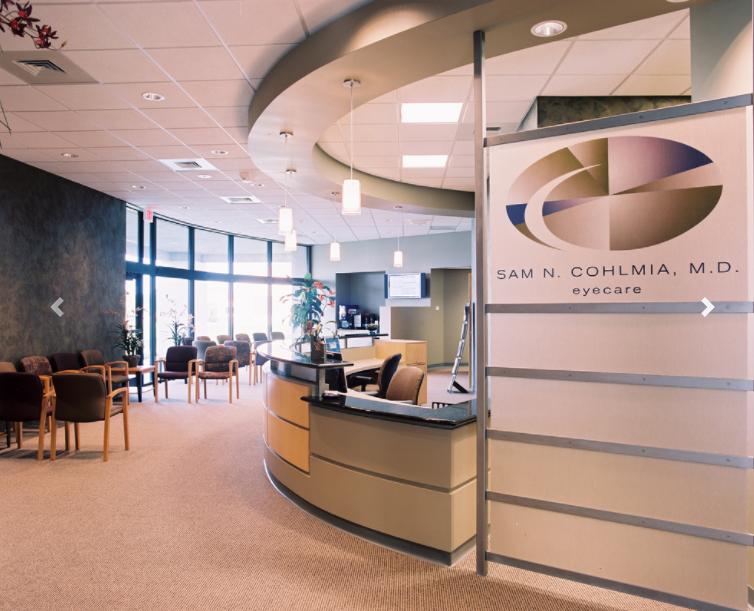
Located in Wilson Estates Business Park at 21st and Webb Road, this medical office has many surrounding medical, restaurant, and retail users, with great 21st Street frontage and only a one-mile drive to access K-96.
Class A Medical office space available in Legacy Park
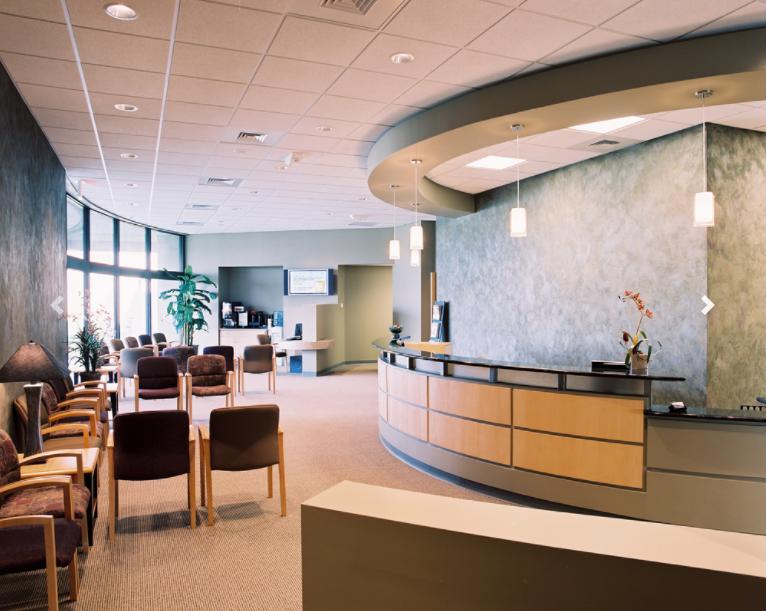
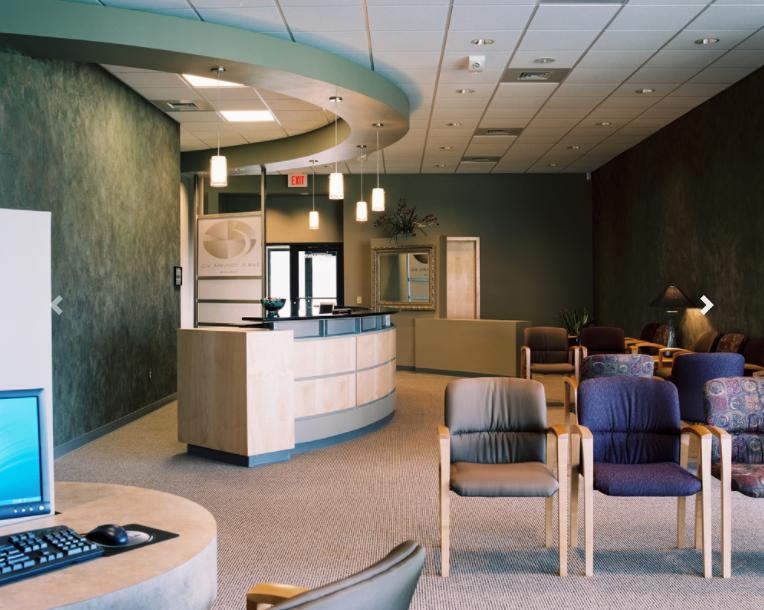
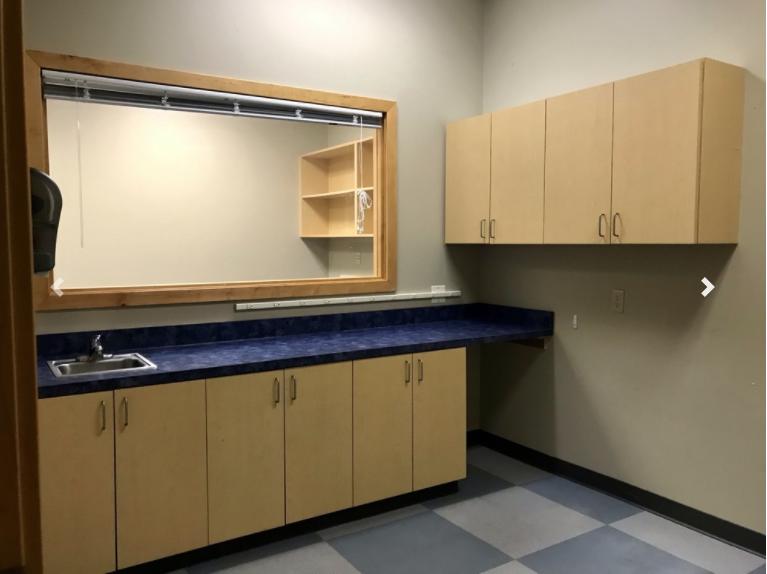
Suite includes 6 exam rooms, office, lab, and break room
21st Street signage and visibility
Building signage available
Close to Bradley Fair Shopping Center and Webb Road medical corridor
Adjacent to affluent northeast Wichita neighborhoods
No part of this information may be copied, reproduced, repurposed, or screen-captured for any commercial purpose without prior written authorization from MyEListing.
While we strive to provide the most accurate information, all listing information, and demographic data, is provided by third-parties. As such, MyEListing will not be responsible for the accuracy of the information. It is strongly recommended that you verify all information with the listing agent, and any relevant agencies, prior to making any decisions.
What is the asking price for 9449 East 21st Street North in Wichita?
The asking price for 9449 East 21st Street North is $18.50 a SF per Year
What is the building size of this commercial Office property?
The size of this lease property at '.9449 East 21st Street North.' is 3027 square feet
What kind of Office is the propery at 9449 East 21st Street North?
The property at 9449 East 21st Street North Wichita, KS 67206 is listed as a Medical Office property
What is the population within 1 mile of 9449 East 21st Street North in Wichita?
The population within 1 mile of 9449 East 21st Street North Wichita, KS 67206 is 5,265 people.
Who do I contact for questions about 9449 East 21st Street North?
You should contact the listing agent,
Nathan Farha, for any details regarding this commercial listing.