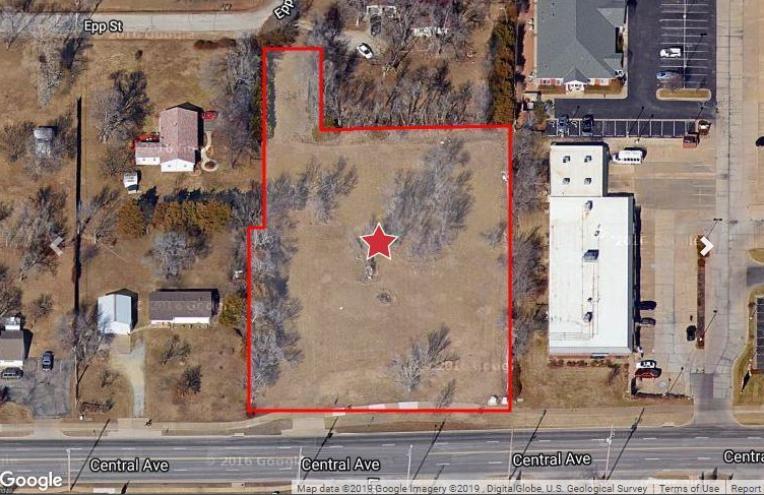
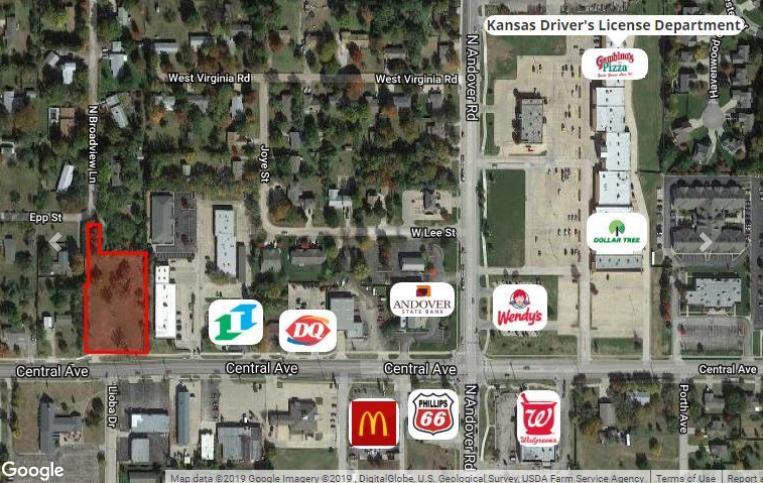
1-Mile | 3-Miles | 5-Miles | ||
---|---|---|---|---|
Total Population | 4,962 | 21,757 | 46,253 | |
Population Median Age | 37 | 38 | 37 | |
Population by Age | 0-9 Yrs | 759 (15%) | 3070 (14%) | 6685 (14%) |
10-19 Yrs | 781 (15%) | 3560 (16%) | 6948 (15%) | |
20-29 Yrs | 505 (10%) | 1873 (8%) | 4808 (10%) | |
30-39 Yrs | 614 (12%) | 2545 (11%) | 6052 (13%) | |
40-49 Yrs | 649 (13%) | 2975 (13%) | 6285 (13%) | |
50-59 Yrs | 649 (13%) | 3049 (14%) | 6324 (13%) | |
60-69 Yrs | 524 (10%) | 2376 (10%) | 4817 (10%) | |
70+ Yrs | 482 (9%) | 2309 (10%) | 4333 (9%) | |
Median HH Income | $88,345 | $96,250 | $93,496 | |
Total Household Income | < 24K | 188 (10%) | 661 (8%) | 1311 (8%) |
25-49K | 305 (17%) | 1105 (14%) | 2399 (14%) | |
50-74K | 236 (13%) | 1088 (13%) | 2444 (14%) | |
75-99K | 290 (16%) | 1234 (15%) | 2724 (16%) | |
100-199K | 615 (34%) | 2636 (33%) | 5108 (31%) | |
200K+ | 133 (7%) | 1082 (13%) | 2353 (14%) | |
Highest Education Level | No Diploma | 150 | 559 | 1468 |
Diploma or GED | 471 | 2076 | 4926 | |
Some College | 666 | 2582 | 5796 | |
Assoc. Degree | 297 | 990 | 2321 | |
Bachelors Degree | 826 | 4631 | 9037 | |
Higher Degree | 648 | 3311 | 6674 | |
Total Housing Units | 1,886 | 8,093 | 17,281 | |
--Owner-Occupied | 1,411 | 6,373 | 13,017 | |
--Renter-Occupied | 356 | 1,433 | 3,321 | |
Owner-Occupied Values | < 100K | 139 | 454 | 948 |
100-199K | 530 | 1798 | 4053 | |
200-299K | 539 | 2263 | 4370 | |
300-399K | 75 | 1003 | 1902 | |
400-499K | 108 | 437 | 806 | |
500K+ | 20 | 417 | 938 | |
Total Working Age Population | 3,687 | 16,338 | 34,729 | |
In Work Force | 2,454 | 10,872 | 24,013 | |
Not In Work Force | 1,233 | 5,466 | 10,716 | |
Workforce Employed | 2,398 | 10,520 | 23,028 | |
Workforce Unemployed | 19 | 244 | 637 | |
Civlian Workforce | 2,418 | 10,764 | 23,665 | |
Military Workforce | 36 | 107 | 348 | |
Total Households | 1,767 | 7,806 | 16,338 | |
Family Households | 1,296 | 6,118 | 12,656 | |
Non-Family Households | 471 | 1,688 | 3,682 | |
Married Couple | 1,145 | 5,241 | 10,563 | |
Other Family | 150 | 877 | 2,093 | |
Married w/Child | 569 | 2,332 | 4,669 | |
Single Male w/Child | 10 | 223 | 522 | |
Single Female w/Child | 53 | 311 | 698 |
Population Change Last Two Decades - Plus Projection
2000 | % | 2010 | % | 2020 | % | 2030 | |
---|---|---|---|---|---|---|---|
Kansas | 2,688,418 | +6 | 2,853,118 | +5 | 2,988,194 | +5 | 3,140,008 |
Butler County | 59,482 | +11 | 65,880 | +3 | 67,627 | +4 | 70,001 |
Sedgwick County | 452,869 | +10 | 498,365 | +6 | 530,232 | +7 | 565,494 |
Total Working Age Population:
Total Households:
Total Working Age Population:
Total Households:
Total Working Age Population:
Total Households: