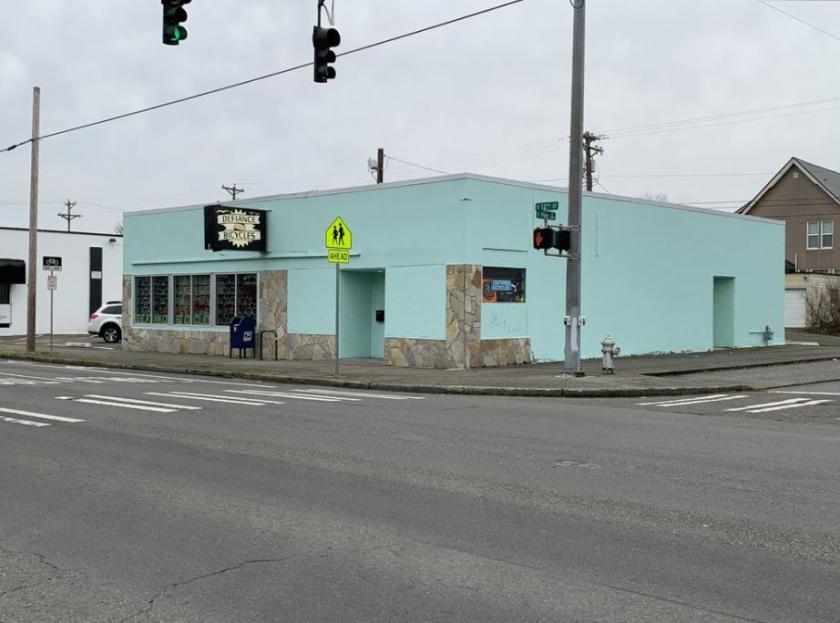
Retail Space
2901 South 12th Street Tacoma, WA 98405
2901 South 12th Street Tacoma, WA 98405
Details & Description
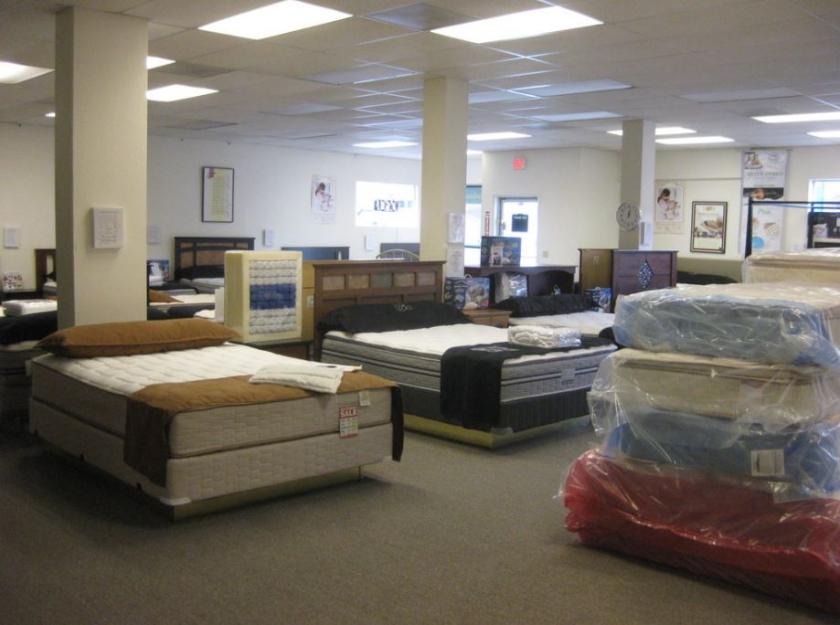
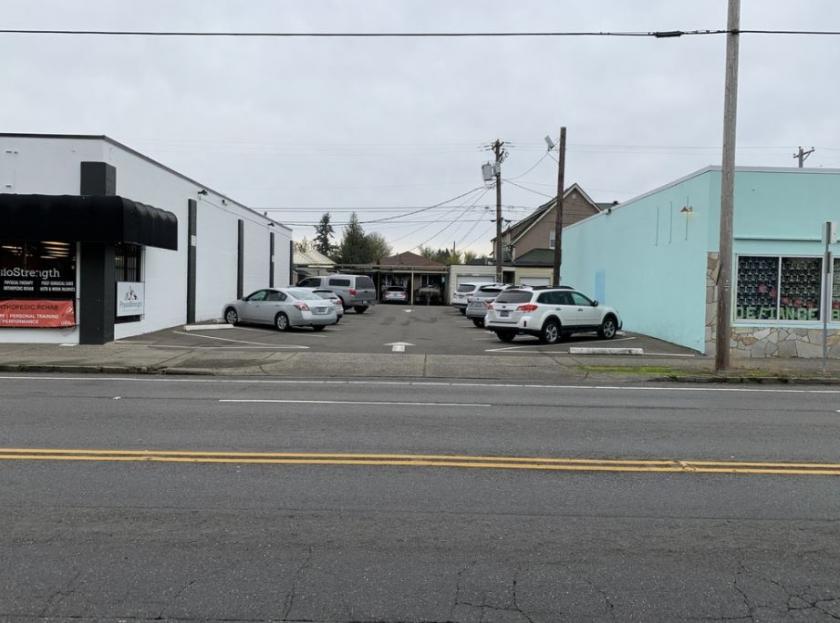
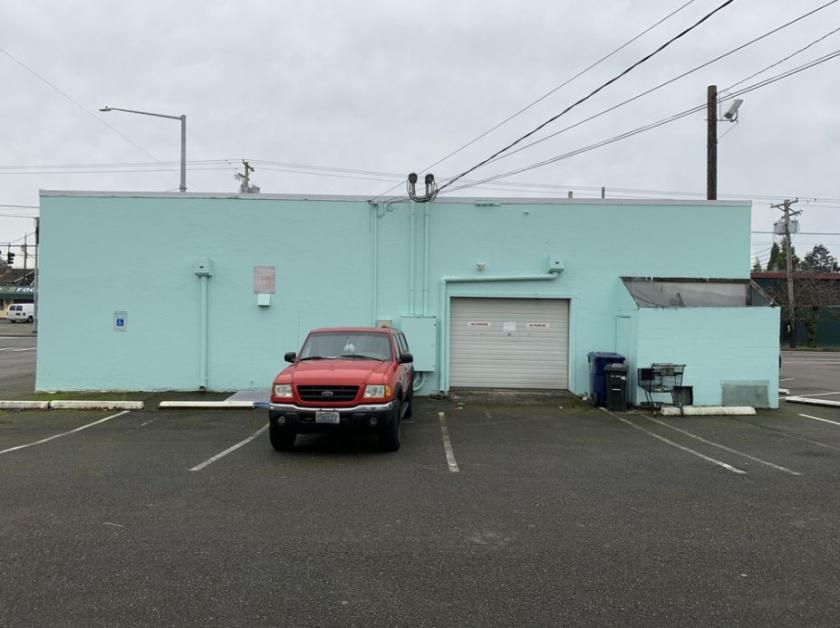
Additional Photos
Listing Agents

Bruce Goldstein
O: 425-586-5632
M: 206-972-6650
bgoldstein@nai-psp.com
O: 425-586-5632
M: 206-972-6650
bgoldstein@nai-psp.com
While we strive to provide the most accurate information, all listing information, and demographic data, is provided by third-parties. As such, MyEListing will not be responsible for the accuracy of the information. It is strongly recommended that you verify all information with the listing agent, and any relevant agencies, prior to making any decisions.


