Retail Space
3571 West Ina Road Tucson, AZ 85741
3571 West Ina Road Tucson, AZ 85741
Details & Description
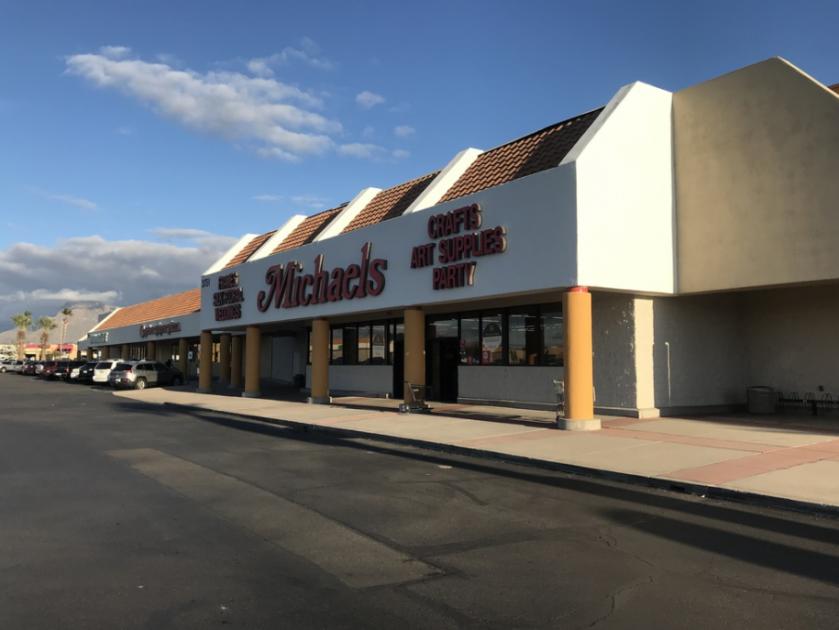
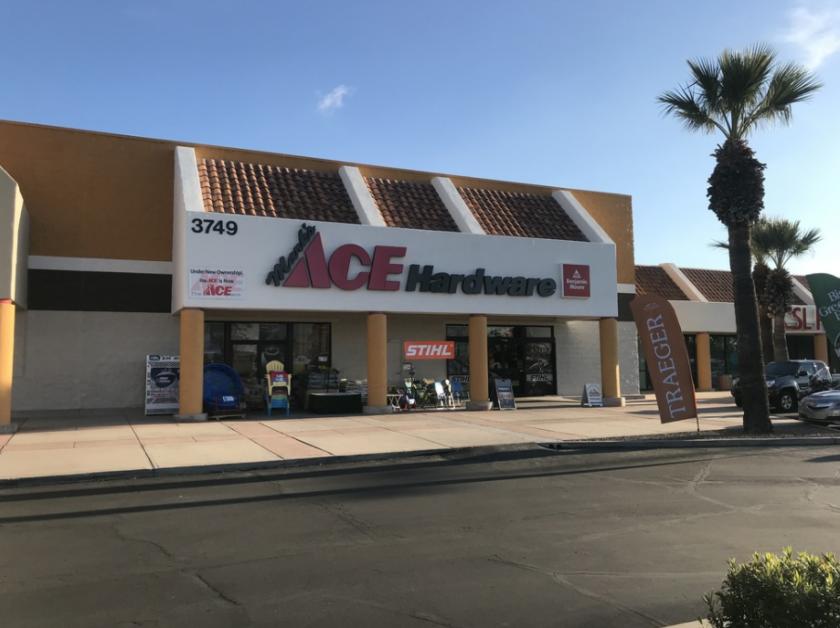
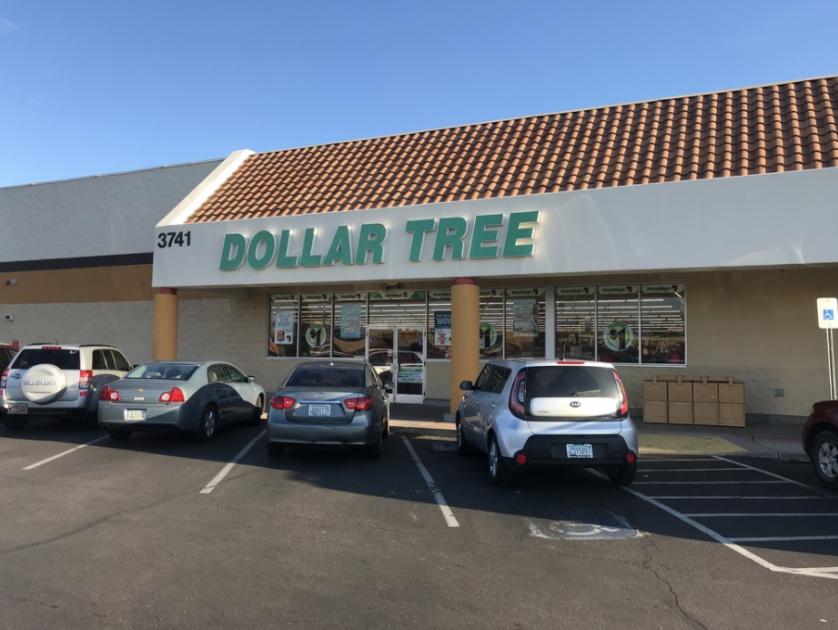
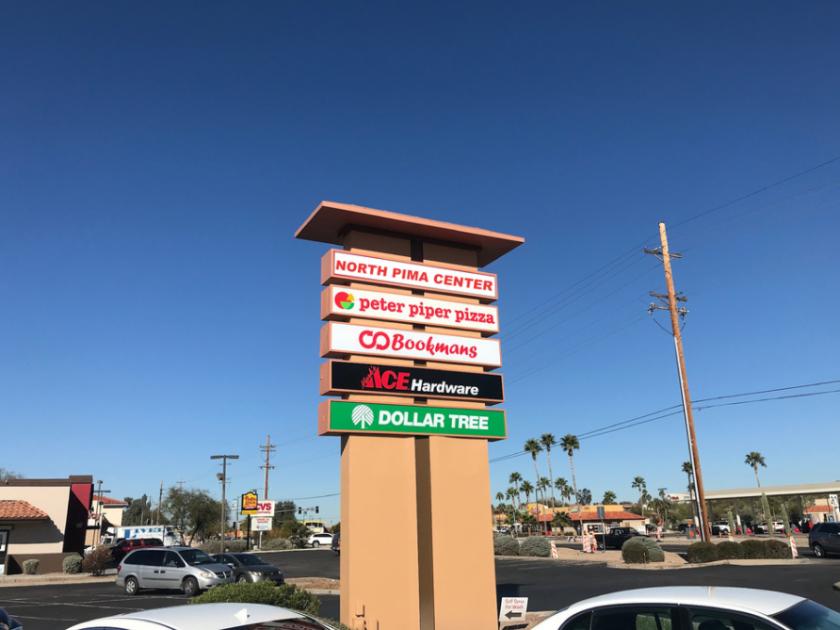
Additional Photos

Listing Agents

Dave Dutson
O: 520-999-3731
M: 520-241-1160
dave.dutson@naihorizon.com
O: 520-999-3731
M: 520-241-1160
dave.dutson@naihorizon.com
While we strive to provide the most accurate information, all listing information, and demographic data, is provided by third-parties. As such, MyEListing will not be responsible for the accuracy of the information. It is strongly recommended that you verify all information with the listing agent, and any relevant agencies, prior to making any decisions.


