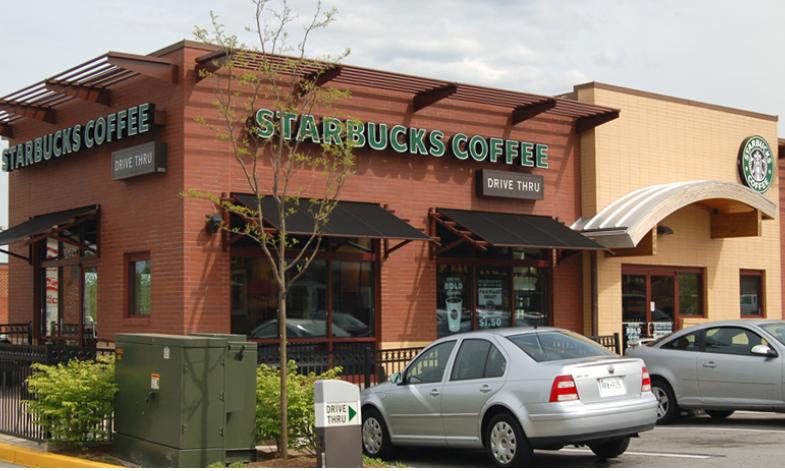
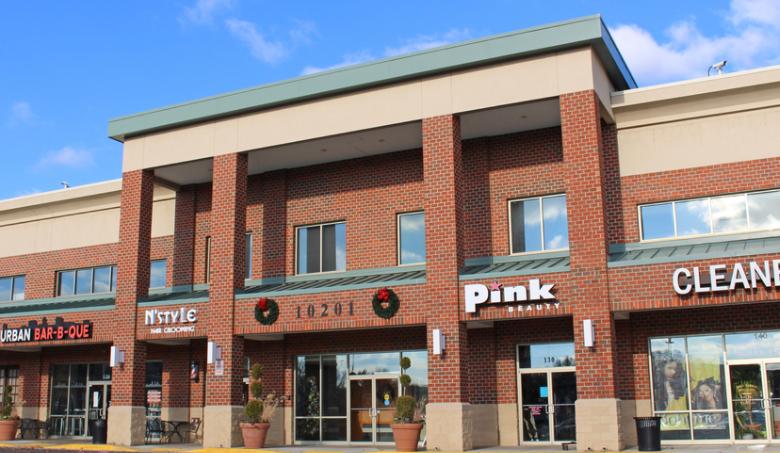
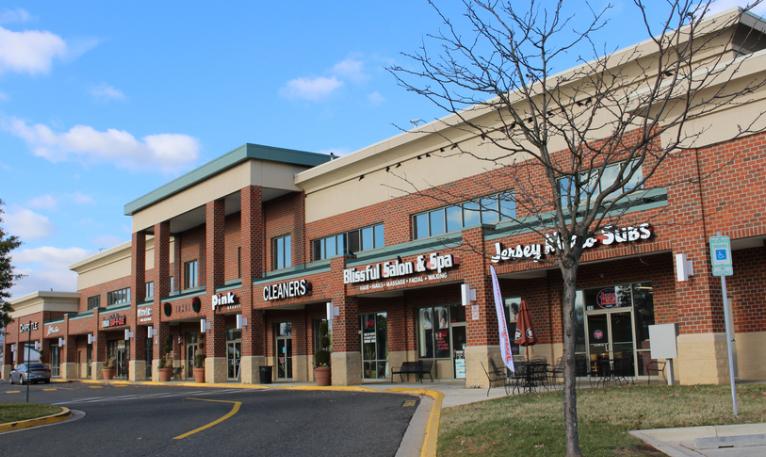
1-Mile | 3-Miles | 5-Miles | ||
---|---|---|---|---|
Total Population | 8,135 | 81,357 | 232,333 | |
Population Median Age | 39 | 38 | 38 | |
Population by Age | 0-9 Yrs | 1017 (12%) | 10457 (12%) | 30975 (13%) |
10-19 Yrs | 946 (11%) | 10558 (12%) | 28241 (12%) | |
20-29 Yrs | 975 (11%) | 10428 (12%) | 30136 (12%) | |
30-39 Yrs | 1064 (13%) | 10733 (13%) | 32581 (14%) | |
40-49 Yrs | 1252 (15%) | 11031 (13%) | 31136 (13%) | |
50-59 Yrs | 1212 (14%) | 11490 (14%) | 32917 (14%) | |
60-69 Yrs | 1070 (13%) | 9531 (11%) | 26928 (11%) | |
70+ Yrs | 598 (7%) | 7129 (8%) | 19419 (8%) | |
Median HH Income | $118,702 | $97,100 | $89,516 | |
Total Household Income | < 24K | 88 (3%) | 1888 (7%) | 7301 (9%) |
25-49K | 261 (10%) | 3351 (13%) | 11545 (14%) | |
50-74K | 276 (10%) | 4496 (17%) | 13957 (17%) | |
75-99K | 361 (13%) | 3481 (13%) | 11801 (14%) | |
100-199K | 1255 (48%) | 8757 (34%) | 26078 (32%) | |
200K+ | 342 (13%) | 3653 (14%) | 8630 (10%) | |
Highest Education Level | No Diploma | 399 | 5595 | 18285 |
Diploma or GED | 1338 | 12608 | 37874 | |
Some College | 1274 | 11452 | 33514 | |
Assoc. Degree | 462 | 3704 | 9901 | |
Bachelors Degree | 1389 | 12157 | 33445 | |
Higher Degree | 772 | 9587 | 26259 | |
Total Housing Units | 2,643 | 26,935 | 84,001 | |
--Owner-Occupied | 2,269 | 18,937 | 53,160 | |
--Renter-Occupied | 315 | 6,690 | 26,152 | |
Owner-Occupied Values | < 100K | 55 | 709 | 2170 |
100-199K | 228 | 1297 | 7193 | |
200-299K | 700 | 4837 | 16002 | |
300-399K | 771 | 5996 | 15460 | |
400-499K | 378 | 3479 | 7339 | |
500K+ | 137 | 2620 | 4996 | |
Total Working Age Population | 6,512 | 64,452 | 184,283 | |
In Work Force | 4,937 | 45,914 | 132,528 | |
Not In Work Force | 1,575 | 18,538 | 51,755 | |
Workforce Employed | 4,550 | 42,336 | 123,812 | |
Workforce Unemployed | 386 | 3,493 | 8,374 | |
Civlian Workforce | 4,937 | 45,829 | 132,186 | |
Military Workforce | 0 | 84 | 342 | |
Total Households | 2,584 | 25,627 | 79,312 | |
Family Households | 1,975 | 19,070 | 53,607 | |
Non-Family Households | 609 | 6,557 | 25,705 | |
Married Couple | 1,392 | 12,565 | 33,767 | |
Other Family | 583 | 6,505 | 19,840 | |
Married w/Child | 549 | 5,351 | 13,977 | |
Single Male w/Child | 55 | 433 | 1,750 | |
Single Female w/Child | 88 | 2,032 | 6,312 |
Population Change Last Two Decades - Plus Projection
2000 | % | 2010 | % | 2020 | % | 2030 | |
---|---|---|---|---|---|---|---|
District of Columbia | 572,059 | +5 | 601,723 | +21 | 729,501 | +15 | 842,154 |
Maryland | 5,296,486 | +9 | 5,773,552 | +6 | 6,141,900 | +6 | 6,518,750 |
Anne Arundel County | 489,656 | +10 | 537,656 | +7 | 573,250 | +4 | 596,700 |
Montgomery County | 873,341 | +11 | 971,777 | +8 | 1,052,050 | +7 | 1,128,800 |
Prince Georges County | 801,515 | +8 | 863,420 | +6 | 916,150 | +4 | 952,950 |
Total Working Age Population:
Total Households:
Total Working Age Population:
Total Households:
Total Working Age Population:
Total Households: