Commercial Land
2885 South Houghton Road Tucson, AZ 85730
2885 South Houghton Road Tucson, AZ 85730

Details & Description
Property Highlights
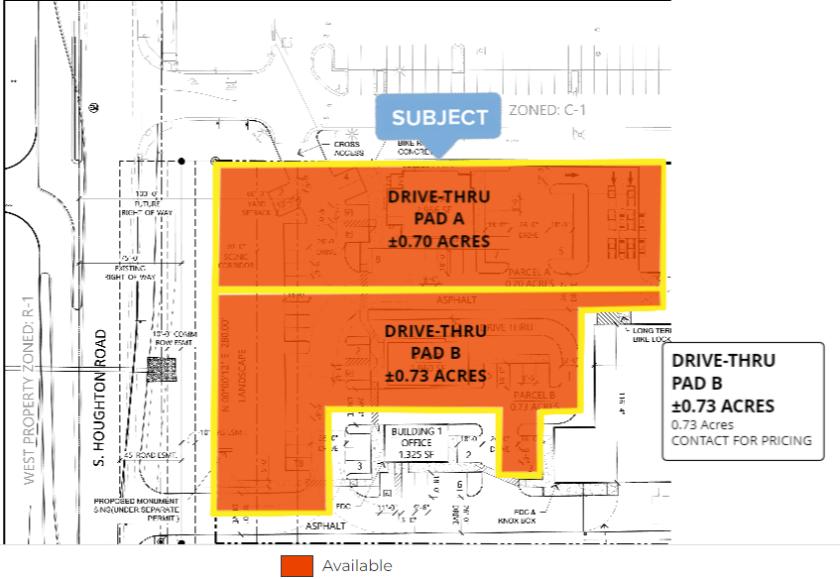
- • PAD A - ±0.70 Acre Drive-Thru Pad Available
- • PAD B - ±0.73 Acre Drive-Thru Pad Available
- • Adjacent to Walmart & CVS Pharmacy
- • All Utilities On-Site
- • Commercial Zoning - C2
Additional Photos


Listing Agents

Bryan Ledbetter
O: 602-795-8670
bledbetter@w-retail.com
O: 602-795-8670
bledbetter@w-retail.com

Bryan Babits
O: 602-931-4491
bbabits@w-retail.com
O: 602-931-4491
bbabits@w-retail.com

Katie Weeks
O: 602-368-1372
kweeks@w-retail.com
O: 602-368-1372
kweeks@w-retail.com
While we strive to provide the most accurate information, all listing information, and demographic data, is provided by third-parties. As such, MyEListing will not be responsible for the accuracy of the information. It is strongly recommended that you verify all information with the listing agent, and any relevant agencies, prior to making any decisions.


