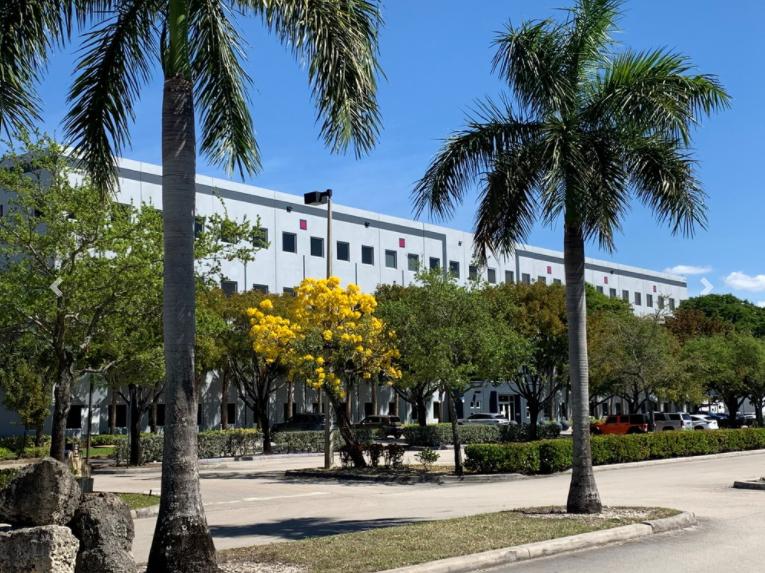
Office Space
7791 Northwest 46th Street Miami, FL 33166
7791 Northwest 46th Street Miami, FL 33166
Details & Description
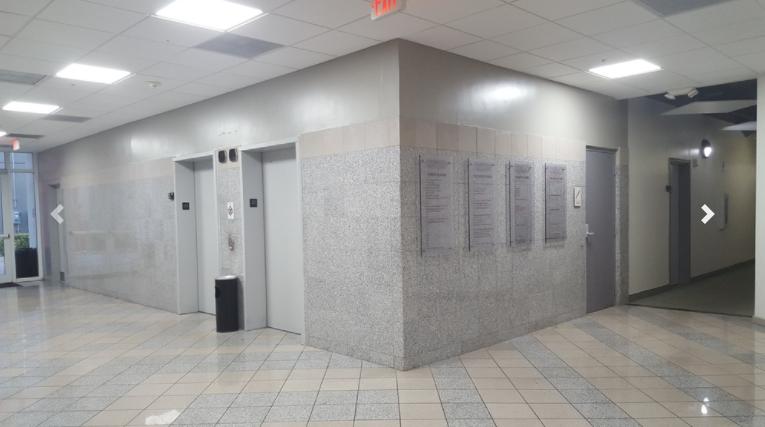
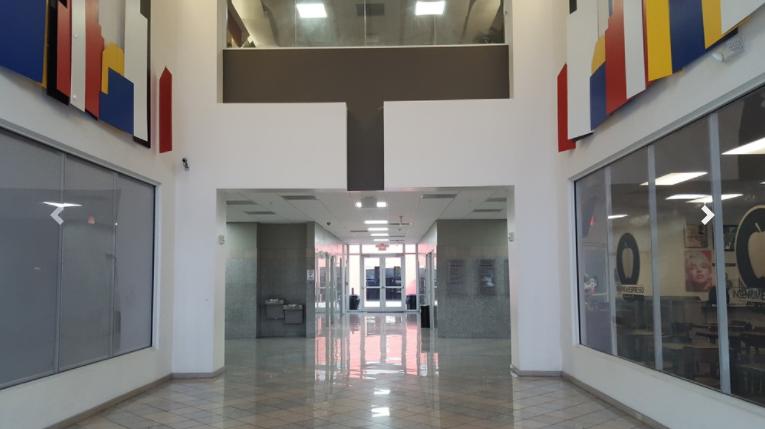
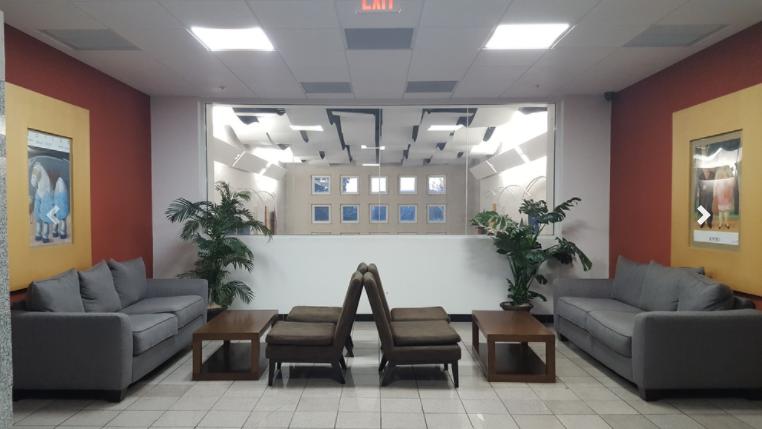
Additional Photos
Listing Agents

Lucia Custer
O: 786-433-0308
M: 305-975-8131
lcuster@naimiami.com
O: 786-433-0308
M: 305-975-8131
lcuster@naimiami.com

Gabriel Garcia-Menocal
M: 786-433-3148
ggarcia-menocal@naimiami.com
M: 786-433-3148
ggarcia-menocal@naimiami.com
While we strive to provide the most accurate information, all listing information, and demographic data, is provided by third-parties. As such, MyEListing will not be responsible for the accuracy of the information. It is strongly recommended that you verify all information with the listing agent, and any relevant agencies, prior to making any decisions.


